3.5 Refineries
Overview
Relative to Public Power Plants and Industrial
Combustion Plants, Refineries are only responsible for a quite small part
of the total European emissions. However individual Refineries can produce emissions
nearly as high as the largest Industrial Combustion Plants, e.g. for NOx.
The emissions of boilers within Refineries should have been included into the emission
of this source group according the CORINAIR 90 methodology. Some countries however, seemed
to have reported boilers in refineries as Industrial Combustion Plants.
The top ten for Refineries are nevertheless presented here but one should keep in mind
that big Refineries might be missing and could have been included in Industrial Combustion
Plants
The countries with the biggest Refineries are Spain, Italy and the Netherlands.
Table 19: The ten largest Refineries in
Europe for SO2 NOx and CO2
| SO2 |
CO2 |
NOx |
| Country |
LPS code |
Emission in tonnes |
Country |
LPS code |
Emission in ktonnes |
Country |
LPS code |
Emission in tonnes |
| Spain |
0086 |
24 074 |
Italy |
0055 |
4 045 |
Spain |
0086 |
7 639 |
| Bulgaria2 |
BNFH |
20 801 |
Italy |
0047 |
3 117 |
Netherlands2 |
NL15 |
4 991 |
| Netherlands |
NL15 |
18 597 |
Spain |
0083 |
2 351 |
Slovak Republic |
BA02 |
3 920 |
| France |
2590 |
18 203 |
Spain |
0082 |
1 619 |
Netherlands |
NL15 |
3 861 |
| Slovak Republic |
BA02 |
17 795 |
Netherlands |
NL15 |
1 539 |
Italy |
0063 |
3 660 |
| Spain |
0082 |
14 900 |
Spain |
0086 |
1 452 |
Lithuania |
009 |
3 283 |
| Belgium (Fl. region) |
12 |
14 827 |
France |
2590 |
1 411 |
Spain |
0082 |
3 105 |
| Greece2 |
9 |
14 043 |
Netherlands1 |
NL15 |
1 387 |
Italy |
0055 |
3 000 |
| Italy2 |
0055 |
12 700 |
France1 |
1700 |
1 201 |
Belgium (Fl. region) |
12 |
2 844 |
| Spain |
0089 |
12 618 |
Italy |
0060 |
1 180 |
Bulgaria2 |
BNFH |
2 804 |
| Others |
|
446 021 |
Others |
|
39 020 |
Others |
|
81 989 |
| Total Refineries |
|
634 579 |
Total Refineries |
|
58 322 |
Total Refineries |
|
121 096 |
1
emission reported for SNAP 0401
The SO2 emission of the largest Refinery is only about 5% of the emission of
the SO2 emission of the largest Public Power Plant and the total SO2
emissions of Refineries correspond only to app. 5% of the total SO2 emissions
of Power Plants. This comparison reflects that Power Plants are dominating the emissions
compared to Refineries. However on a local scale the situation might be different, as e.g.
in the area of Bratislava (Slovakia).
The higher contribution to the totals (percentages) for CO2 in comparison to
SO2 and NOx reflect the differences in SO2 and NOx
emission factors of Refinery gas/residual oil compared to coal. The former fuel is mainly
used by Refineries and the latter in the largest Power Plants.
Comparing the ten largest refineries for CO2, NOx and SO2
emissions it is interesting to note that the three largest CO2 emitting
refineries are not among the ten largest SO2 emitting ones (and 2 of the 3
largest CO2 emitting Refineries among the 10 largest ones for NOx).
However six out of the top ten CO2 Refineries are also part of the SO2
ranking list the corresponding number for the NOx-ranking list being seven.
SO2
The 218 Refineries are responsible for 0.3 million tonnes of SO2,
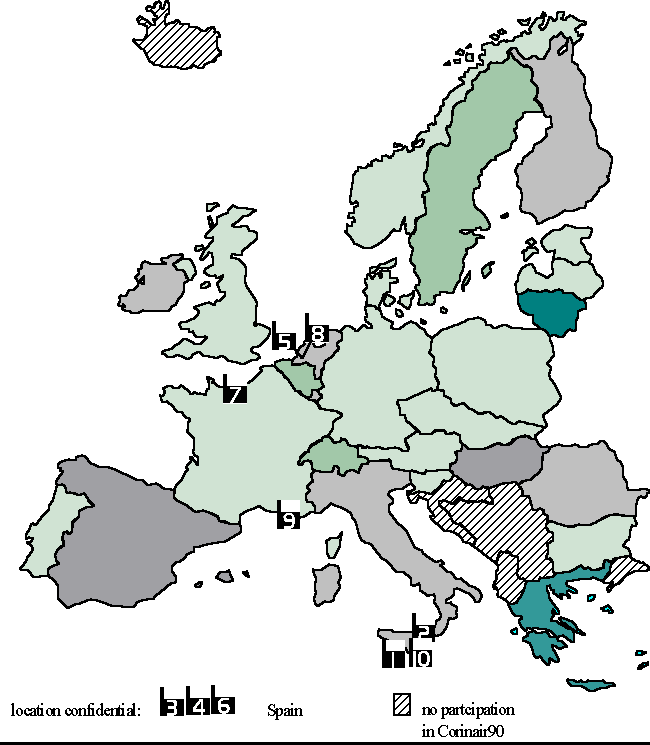
that is 2% of the European total LPS emission (see table 20 and map 7).
Figure 12: The top 100 SO2
emitting Refineries in Europe
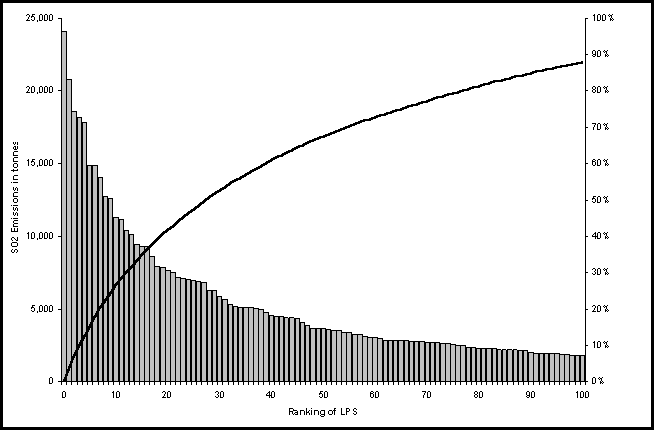
Table 20: The ten largest SO2
emitting Refineries in Europe
| Rank |
Country |
LPS
code |
Emission
in tonnes |
Main fuel |
Region |
1 |
Spain |
0086 |
24 074 |
Refinery gas/residual oil |
Confidential |
2 |
Bulgaria |
BNFH |
20 801 |
Not reported |
BG/Burgas |
3 |
Netherlands |
NL15 |
18 597 |
Refinery gas/residual oil |
Groot Rijnmond |
4 |
France |
2590 |
18 203 |
Refinery gas/residual oil |
Seine Maritime |
5 |
Slovak Republic |
BA02 |
17 795 |
Not reported |
Bratislava |
6 |
Spain |
0082 |
14 900 |
Refinery gas/residual oil |
Confidential |
7 |
Belgium (Fl. region) |
12 |
14 827 |
Refinery gas/residual oil |
Antwerpen (arr) |
8 |
Greece |
9 |
14 043 |
Not reported |
Attiki |
9 |
Italy |
0055 |
12 700 |
Not reported |
Confidential |
10 |
Spain |
0089 |
12 618 |
Refinery gas/residual oil |
Cadiz |
| |
Others |
|
446 021 |
|
|
| |
Total |
|
634 579 |
|
|
>CO2
The 218 Refineries are responsible for 44 million tonnes of CO2, causing 3%
of all LPS emissions (see table 21 and map 8).
Figure 13: The top 100 CO2
emitting Refineries in Europe
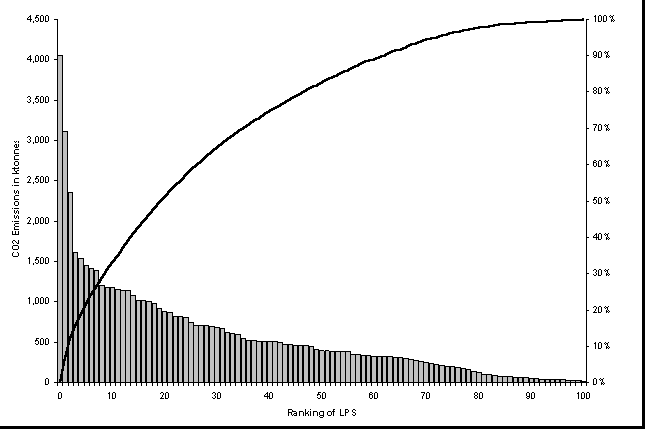
Table 21: The ten largest CO2
emitting Refineries in Europe
| Rank |
Country |
LPS
code |
Emission
in tonnes |
Main fuel |
Region |
1 |
Italy |
0055 |
4 045 |
Refinery gas/residual oil |
Caltanissetta |
2 |
Italy |
0047 |
3 117 |
Refinery gas/residual oil |
Messina |
3 |
Spain |
0083 |
2 351 |
Refinery gas/residual oil |
Confidential |
4 |
Spain |
0082 |
1 619 |
Refinery gas/residual oil |
Confidential |
5 |
Netherlands |
NL15 |
1 539 |
Refinery gas/residual oil |
Groot Rijnmond |
6 |
Spain |
0086 |
1 452 |
Refinery gas/residual oil |
Confidential |
7 |
France |
2590 |
1 411 |
Refinery gas/residual oil |
Seine Maritime |
8 |
Netherlands |
NL15 |
1 387 |
Refinery gas/residual oil |
Groot Rijnmond |
9 |
France |
1700 |
1 201 |
Refinery gas/residual oil |
Bouches du Rhone |
10 |
Italy |
0060 |
1 180 |
Refinery gas/residual oil |
Siracusa |
| |
Others |
|
39 020 |
|
|
| |
Total |
|
58 322 |
|
|
NOx
The 218 Refineries are
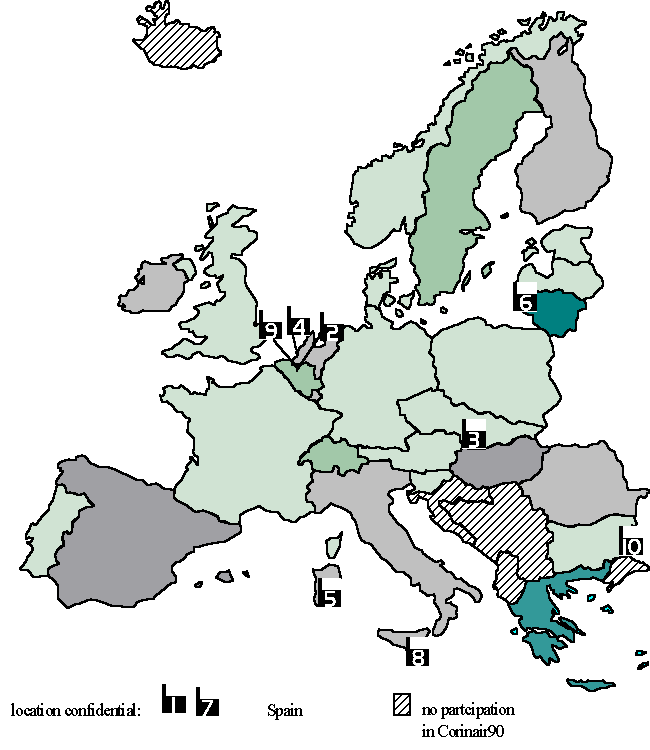
responsible for 0.08 million tonnes of NOx, contributing 2% to the LPS emission total (see
table 22 and map 9).
Figure 14: The top 100 NOx
emitting Refineries in Europe
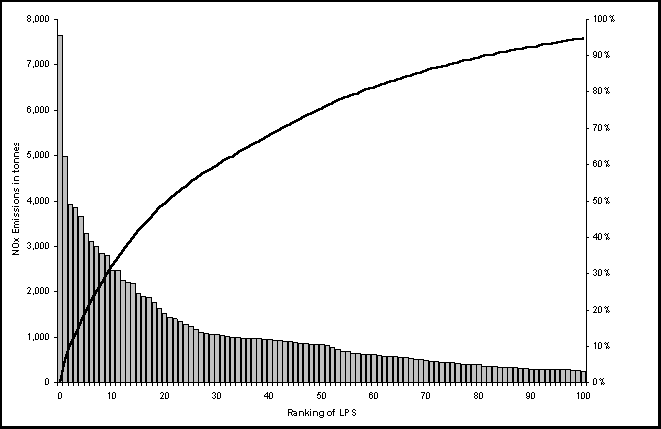
Table 22: The ten largest NOx
emitting Refineries in Europe
| Rank |
Country |
LPS
code |
Emission
in tonnes |
Main fuel |
Region |
1 |
Spain |
0086 |
7 639 |
Refinery gas/residual oil |
Confidential |
2 |
Netherlands |
NL15 |
4 991 |
Refinery gas/residual oil |
Groot Rijnmond |
3 |
Slovak Republic |
BA02 |
3 920 |
Not reported |
Bratislava |
4 |
Netherlands |
NL15 |
3 861 |
Refinery gas/residual oil |
Groot Rijnmond |
5 |
Italy |
0063 |
3 660 |
Refinery gas/residual oil |
Cagliari |
6 |
Lithuania |
009 |
3 283 |
Not reported |
Siauliai Region |
7 |
Spain |
0082 |
3 105 |
Refinery gas/residual oil |
Confidential |
8 |
Italy |
0055 |
3 000 |
Refinery gas/residual oil |
Caltanissetta |
9 |
Belgium (Fl. region) |
12 |
2 844 |
Refinery gas/residual oil |
Antwerpen (arr) |
10 |
Bulgaria |
BNFH |
2 804 |
Not reported |
BG/Burgas |
| |
Others |
|
81 989 |
|
|
| |
Total |
|
121 096 |
|
|
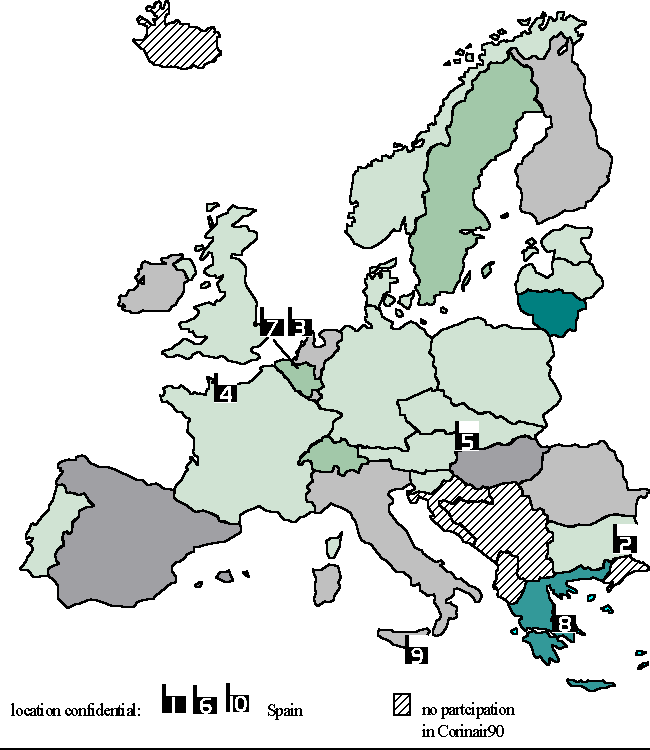
Map 7: The ten largest SO2 -
emitting Refineries in Europe 1990
Map 8: The ten largest CO2
- emitting Refineries in Europe
Map 9: The ten largest NOX -
emitting Refineries in Europe 1990


Document Actions
Share with others