All official European Union website addresses are in the europa.eu domain.
See all EU institutions and bodiesIndustry is an important part of the European economy, providing vital goods for modern life and jobs. At the same time, it is a source of great pressure on nature and on human health. Even though releases of pollutants by European industry have generally decreased over the last decade, the impacts and costs of pollution from industry remain high.
Industrial activities are a source of pressure on the environment, mainly in the form of emissions to the atmosphere and water ecosystems, waste generation and resource consumption.
The biggest industries in Europe are the manufacture of food, beverages and tobacco products, the manufacture of motor vehicles and other transport equipment and the manufacture of basic metals and fabricated metal, according to Eurostat. In 2023, the value of sold production in the European Union amounted to 5 992 billion €.
In 2023 compared with 2022 the EU's industrial production decreased by 1.2%. The recent decrease was recorded in 15 industrial activities with the biggest decrease in the manufacturing of wood and of products of wood and cork, except furniture; manufacture of articles of straw and plaiting materials, followed by the manufacturing of chemicals and chemical products, the manufacturing of basic metals and the manufacturing of paper and paper products.
In 2021, the costs of air pollution caused by Europe’s largest industrial plants corresponded to about 2% of the EU’s GDP. Just one percent (107) of the most polluting industrial facilities — many of them coal power plants — caused half of the total damage. However, the EEA analysis also shows that environmental and health costs of European industry have decreased by a third (-33%) from 2012 to 2021.
People living in large industrial cities or regions typically experience more air pollution. For other pollutants, such as heavy metals, the pathway is more complex. It can be through inhalation, but also through the consumption of contaminated food and drink.
In addition to harming human health, industrial pollutant emissions also harm plants, animals and their habitats, altering breeding cycles and biodiversity. Pollutants can also deposit on buildings and monuments and corrode vital infrastructure, requiring costly repairs.

Heavy metals: Cadmium, mercury, lead...
Heavy metals accumulate in ecosystems and damage human health. In line with the EU’s commitments under international conventions, specific legislation led to reductions in emissions of heavy metals across Europe from 1990 levels.
Between 2005 and 2022, emissions have continued to decline, with lead emissions decreasing by 44%, mercury emissions by 53% and cadmium emissions by 39% across the EU-27 Member States. Germany, Italy and Poland contributed the most to heavy metal emissions during 2022 within the EU.
Phasing out ozone-depleting substances
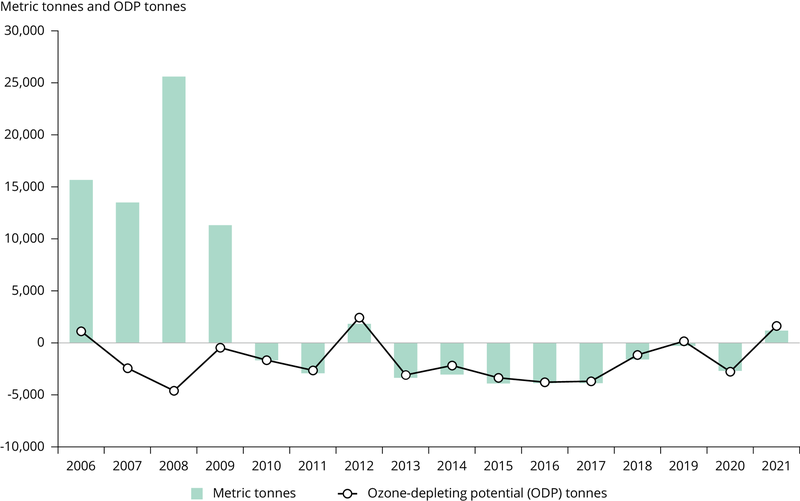
The EU continues to actively phase out ozone-depleting substances (ODS), in line with its commitment under the Montreal Protocol.
In 2023, the consumption of ODS in the EU was positive, amounting to 1,306 metric tonnes. However, this is explained by significant stocks for feedstock use outside the EU. The consumption of ODS is expected to decrease again when the quantities stockpiled in 2023 are exported.

The costs to health and the environment from industrial air pollution
Air pollution from large European industry continues to cause significant damage to the environment, climate and people’s health.
The analysis shows that just a small fraction of the most polluting facilities — many of them coal power plants — causes half of the total damage.
However, the EEA analysis also shows that environmental and health costs of European industry have decreased by a third (-33%) from 2012 to 2021. The EU energy sector has accounted for the vast majority — about 80% — of the total decrease.
How much pollutant does large industry release to nature?
The European Union has strict regulations on industrial pollution. Check out the European Industrial Emissions Portal for detailed information on the largest industrial complexes in Europe, releases and transfers of regulated pollutants to air, water and soil, as well as waste transfers and much more.
Check industrial pollution in your country
Country profiles are available for each of the 33 EEA member countries individually as well as one profile on all 33 EEA member countries and another one for all EU-27 Member States as a group.
These profiles summarise key data related to industry: its relevance with respect to economic contributions, energy and water consumption, as well as air and water emissions and waste generation.


