All official European Union website addresses are in the europa.eu domain.
See all EU institutions and bodiesMost European city dwellers are exposed to unsafe levels of air pollution. Improving air quality to match World Health Organization (WHO)-recommended levels could prevent more than half of premature deaths caused by exposure to fine particulate matter.
Air pollution emissions have declined in the last two decades, resulting in better air quality. Between 2005 and 2022, the number of deaths in the EU attributable to PM2.5 fell by 45%, moving the EU closer to achieving the 55% reduction target outlined in the zero pollution action plan for 2030. Despite this improvement, air pollution remains the largest environmental health risk in Europe. Exposure to fine particulate matter, ozone and nitrogen dioxide levels above the World Health Organization recommendations cause an estimated 239,000, 70,000 and 48,000 premature deaths, respectively, in 2022. These pollutants are linked to asthma, heart disease and stroke.
Air pollution also causes morbidity. People live with diseases related to exposure to air pollution; this is a burden in terms of personal suffering as well as significant costs to the healthcare sector.
Society’s most vulnerable are more susceptible to air pollution impacts. Lower socio-economic groups tend to be exposed to higher levels of air pollution, while older people, children and those with pre-existing health conditions are more susceptible. Over 1,200 deaths in people under 18 years of age are estimated to be caused by air pollution every year in EEA member and collaborating countries.
Besides health issues, air pollution can considerably impact Europe’s economy due to increased healthcare costs, reduced life expectancy, and lost working days across sectors. It also damages vegetation and ecosystems, water and soil quality, and local ecosystems.
Premature deaths in the EU in 2022
239,000
from chronic exposure to fine particulate matter
48,000
from chronic nitrogen dioxide exposure
70,000
from acute ozone exposure
Source: EEA, 2024, Harm to human health from air pollution in Europe: burden of disease status, 2024
Europe’s air quality improving, but health challenges remain
Air pollution across Europe continues to decline, yet 94% of the urban population remains exposed to fine particulate matter (PM2.5) above WHO guideline levels — the pollutant most harmful to human health.
This EEA report presents the latest 2023–2024 data, comparing concentrations against current EU standards, stricter 2030 targets, and WHO recommendations, showing where progress is being made — and where further action is needed, especially in cities, to meet future standards and reduce health risks.


Check air quality at any time: European Air Quality Index & App
How clean is the air you’re breathing right now?
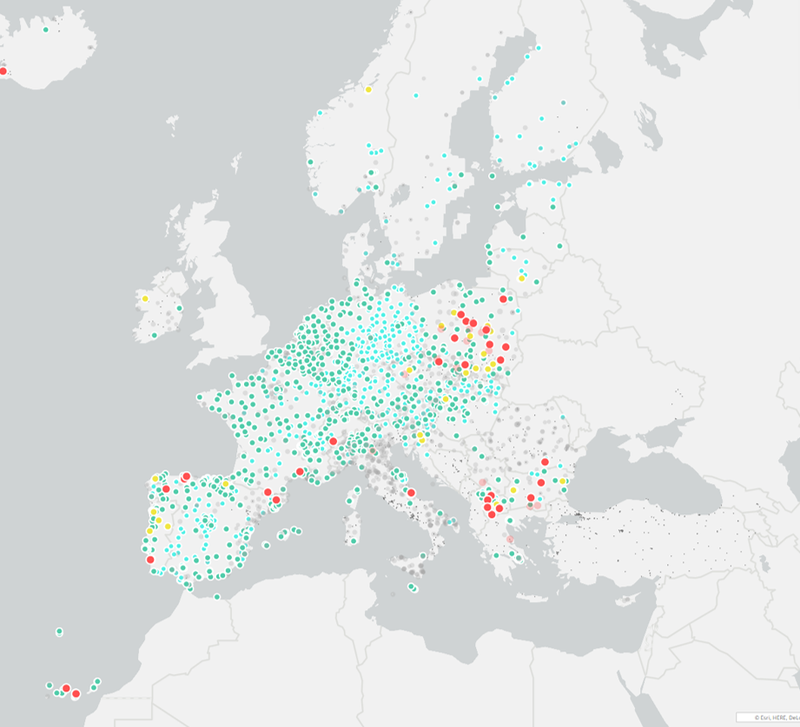
The European Air Quality Index provides information on the current air quality situation based on measurements from more than 2000 air quality monitoring stations across Europe.
The Index allows citizens to use an interactive map to check the air quality at station level, based on five key pollutants that harm people's health and the environment: namely particulate matter (both PM2.5 and PM10), ground-level ozone, nitrogen dioxide and sulphur dioxide.
The index is also available as an app for mobile phones in all EU languages.
Air quality in your city: how clean is it compared to other European cities?
The costs to health and the environment from industrial air pollution
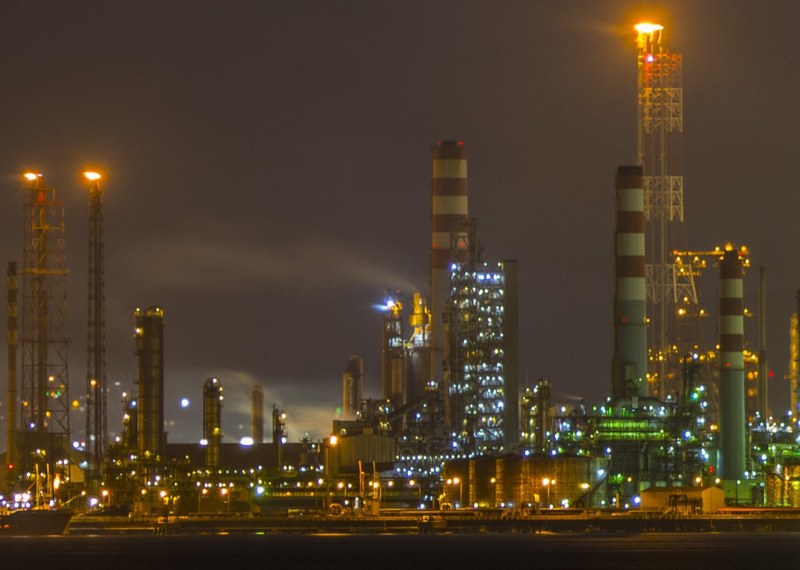
Air pollution from large European industry continues to cause significant damage to the environment, climate and people’s health.
The analysis shows that just a small fraction of the most polluting facilities — many of them coal power plants — causes half of the total damage.
However, the EEA analysis also shows that environmental and health costs of European industry have decreased by a third (-33%) from 2012 to 2021. The EU energy sector has accounted for the vast majority — about 80% — of the total decrease.

