3.3. Public power plants
Overview
Public Power Plants
are by far the largest source of point source emissions in Europe. A comparison of the
three pollutants presented in this report shows that the biggest sources for CO2
are not necessarily the largest contributors to SO2 and NOx
emissions as well (see table 11).
In this chapter the ten largest LPS
are given for each of the source sectors and pollutants as an example of the data
available in CORINAIR 90.
Table 11: The ten largest Public Power Plants
in Europe for SO2 NOx and CO2
| SO2 |
CO2 |
NOx |
| Country |
LPS code |
Emission in tonnes |
Country |
LPS code1 |
Emission in ktonnes |
Country |
LPS code1 |
Emission in tonnes |
| Spain |
0113 |
521 769 |
Poland |
5902 |
27 716 |
United Kingdom |
117 |
87 966 |
| Bulgaria |
MRI2 |
444 991 |
Greece |
1 |
26 578 |
Poland |
5902 |
87 944 |
| Bulgaria |
TVAR |
421 996 |
Germany (f. East) |
25 |
23 915 |
Greece |
1 |
61 600 |
| Poland |
5902 |
402 412 |
Germany (f. East) |
5 |
23 661 |
United Kingdom |
138 |
47 894 |
| Spain |
0104 |
321 331 |
United Kingdom |
117 |
22 561 |
United Kingdom |
122 |
47 633 |
| Germany (f. East) |
25 |
316 976 |
Poland |
2301 |
14 336 |
United Kingdom |
113 |
46 350 |
| United Kingdom |
117 |
269 283 |
Germany (f. East) |
60 |
12 876 |
United Kingdom |
118 |
45 310 |
| Germany (f. East) |
05 |
265 144 |
United Kingdom |
138 |
12 284 |
Spain |
103 |
45 034 |
| Germany (f. East) |
22 |
205 480 |
United Kingdom |
122 |
12 217 |
United Kingdom |
150 |
42 098 |
| Germany (f. East) |
23 |
198 440 |
Germany (f. West) |
80 |
12 137 |
Italy |
40 |
40 900 |
| Others |
|
10 323 469 |
Others |
|
971 995 |
Others |
|
2 763 695 |
| Total Public Power Plants |
|
13 691 291 |
Total Public Power Plants |
|
1 160 276 |
Total Public Power Plants |
|
3 316 424 |
The next three chapters
give a more detailed description for these top ten LPS.
SO2
The 478 Public Power Plants
>300MW are responsible for 14 million tonnes of SO2, which
is equal to 74% of all SO2 LPS emissions.
The ranking in figure 6 shows that
the ten biggest LPS are emitting 24% and the top 100 are emitting 80% of the LPS emissions
of Public Power Plants >300MW.
Figure 6: The top 100 SO2 emitting
Public Power Plants in Europe
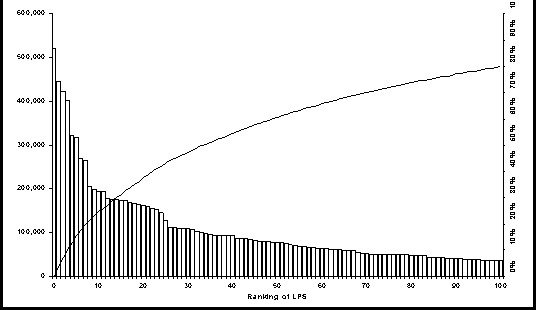
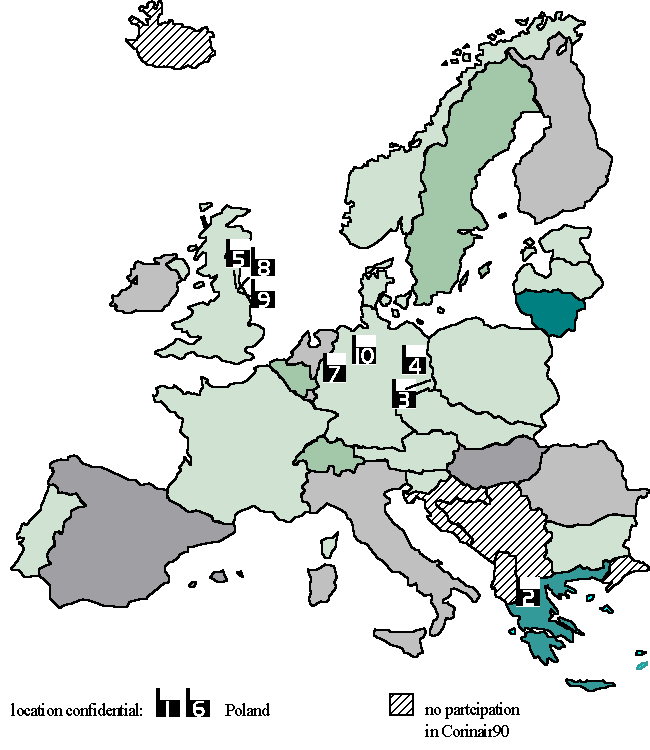
The largest emitting plant is
located in Spain and emits more than half a million tonnes SO2 per year,
followed by plants in Bulgaria, Poland, Germany (former East) and the United Kingdom (see
map 1 and table 12).
Table 12: The ten largest SO2
emitting Public Power Plants in Europe
| Rank |
Country |
LPS³
code |
Emission
in tonnes |
Thermal
capacity in MWth |
Main fuel |
Region |
1 |
Spain |
0113 |
521 769 |
3 430 |
Brown coal/ lignite |
Confidential |
2 |
Bulgaria |
MRI2 |
444 991 |
1 660 |
Residual oil |
BG / Haskovo |
3 |
Bulgaria |
TVAR |
421 996 |
3 504 |
Steam coal |
BG / Varna |
4 |
Poland |
5902 |
402 412 |
9 999 |
Brown coal/ lignite |
Confidential |
5 |
Spain |
0104 |
321 331 |
2 573 |
Sub-bituminous |
Confidential |
6 |
Germany (f. East) |
25 |
316 976 |
9 9992 |
Not reported |
Weißwasser |
7 |
United Kingdom |
117 |
269 283 |
3 890 |
Not reported |
North Yorkshire |
8 |
Germany (f. East) |
05 |
265 144 |
8 850 |
Not reported |
Cottbus |
9 |
Germany (f. East) |
22 |
205 480 |
2 300 |
Not reported |
Borna |
10 |
Germany (f. East) |
23 |
198 440 |
4 720 |
Not reported |
Görlitz |
| |
Others |
|
10 323 469 |
|
|
|
| |
Total |
|
13 691 291 |
|
|
|
The thermal capacities differ
widely for these top ten LPS, indicating that fuel consumption or utilisation rate is more
important regarding emissions than the (installed) thermal capacity.
Brown Coal dominates the picture as
a fuel for the largest SO2 emitting point sources. As already mentioned Germany
and the United Kingdom did not provide details on fuel consumption but one may expect that
the plants in Germany (former east) also used mainly Brown Coal (see table 12). None of
the top ten point sources reported a control device for SO2 emissions.
The LPS six to ten have been
notified as subject to the LCP Directive. Each is specified as an existing one, meaning
that these plants started operation before 1987.
CO2
The 478 Public Power Plants
>300MW are responsible for 1.2 billion tonnes CO2, amounting to 67% of
all CO2 LPS emissions. The ranking is quite similar to that of SO2
(see figure 7).
Figure 7: The top 100 CO2 emitting
Public Power Plants in Europe
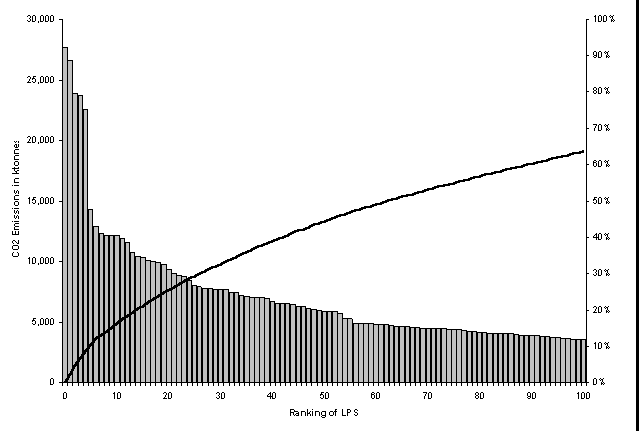
The countries with the ten
largest CO2 emitting plants are Poland, Greece, Germany (former East and West)
and the United Kingdom (see map 2).
Table 13: The ten largest CO2
emitting Public Power Plants in Europe
| Rank |
country |
LPS
code |
Emission
in ktonnes |
Thermal
capacity in MWth |
Main fuel |
Region |
1 |
Poland |
5902 |
27 716 |
9 999 |
Brown coal/lignite |
Confidential |
2 |
Greece |
1 |
26 578 |
3 515 |
Not reported |
Kozani |
3 |
Germany (f. East) |
25 |
23 915 |
9 999² |
Not reported |
Weißwasser |
4 |
Germany (f. East) |
05 |
23 661 |
8 850 |
Not reported |
Cottbus |
5 |
United Kingdom |
117 |
22 561 |
3 890 |
Not reported |
North Yorkshire |
6 |
Poland |
2301 |
14 336 |
6 692 |
Brown coal/lignite |
Confidential |
7 |
Germany (f. West) |
60 |
12 876 |
7 435 |
Not reported |
Erftkreis |
8 |
United Kingdom |
138 |
12 284 |
1 974 |
Not reported |
Nottinghamshire |
9 |
United Kingdom |
122 |
12 217 |
1 966 |
Not reported |
West Yorkshire |
10 |
Germany (f. West) |
80 |
12 137 |
1 658 |
Not reported |
Hamm, Kreisfreie Stadt |
| |
Others |
|
971 995 |
|
|
|
| |
Total |
|
1 160 276 |
|
|
|
Not so much fuel data is available
for the ten biggest CO2 emitting plants in Europe. In comparison to SO2
the second plant from Poland also uses Brown Coal as main fuel.
From the top ten LPS only Poland
specified the actual rate of fuel consumption, but specified this information as
confidential.
All the plants located in the EU
countries (top 2 to 5 and 7 to 10) are covered by the LCP directive and reported by the
countries as existing plants.
Contrary to SO2 there are
some plants among the biggest CO2 emitting plants located in former West
Germany. This reflects emission reduction activities for SO2 in this country.
NOx
The 478 Public Power Plants >300MW are
responsible for 3.3 million tonnes of NOx in Europe. This represents 69% of the
total NOx LPS emission reported.
The ranking again shows the same
picture as for SO2 and NOx before (see figure 8).
Figure 8: NOx
emitting Public Power Plants in Europe
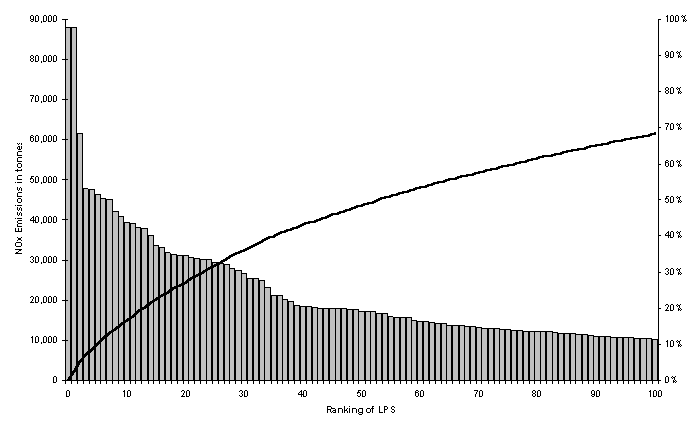
Table 14: The ten largest NOx
emitting Public Power Plants in Europe
| Rank |
Country |
LPS
code |
Emission
in tonnes |
Thermal
capacity in MWth |
Main fuel |
Region |
1 |
United Kingdom |
117 |
87 966 |
3 890 |
Not reported |
North Yorkshire |
2 |
Poland |
5902 |
87 944 |
9 999 |
Brown coal/lignite |
Confidential |
3 |
Greece |
1 |
61 600 |
3 515 |
Not reported |
Kozani |
4 |
United Kingdom |
138 |
47 894 |
1 974 |
Not reported |
Nottinghamshire |
5 |
United Kingdom |
122 |
47 633 |
1 966 |
Not reported |
West Yorkshire |
6 |
United Kingdom |
113 |
46 350 |
1 970 |
Not reported |
Nottinghamshire |
7 |
United Kingdom |
118 |
45 310 |
1 971 |
Not reported |
Humberside |
8 |
Spain |
0103 |
45 034 |
3 214 |
Residual oil |
Confidential |
9 |
United Kingdom |
150 |
42 098 |
1 988 |
Not reported |
Nottinghamshire |
10 |
Italy |
0040 |
40 900 |
6 597 |
Residual oil |
Roma |
| |
Others |
|
2 763 695 |
|
|
|
| |
Total |
|
3 316 424 |
|
|
|
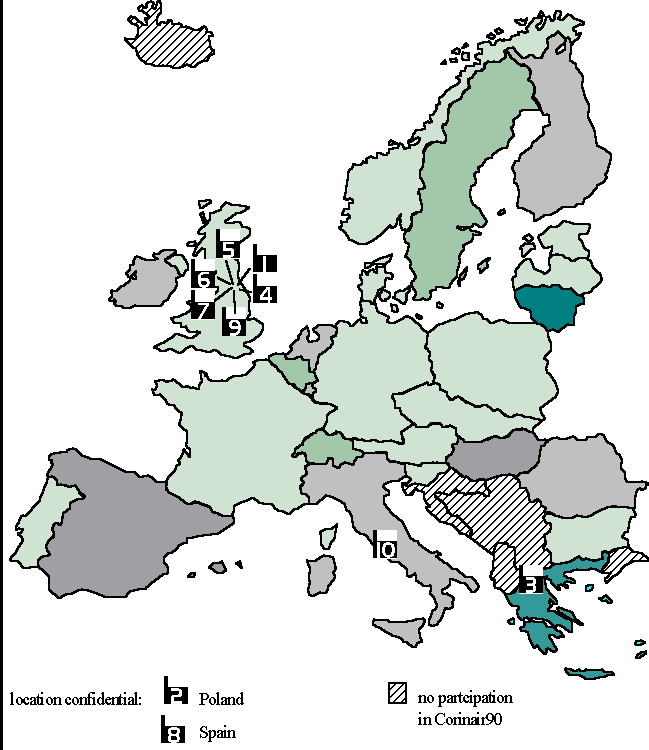
Compared to table 12 (SO2)
and table 13 (CO2) two additional plants appear in table 14 and on map 3. The
main fuel of these two additional plants is Residual Oil. Five of the top ten LPS are
located in the United Kingdom. Surprisingly no German plants are among the top ten LPS.
This may be due to NOx reduction activities such as low NOx burner
and DENOX facilities and to the low efficiency of the plants in Germany (former east), but
this is not clear from the CORINAIR database. The Italian plant is also covered by the LCP
directive specified as existing plant.
Map 1: The ten largest SO2 -
emitting Public Power Plants in Europe 1990
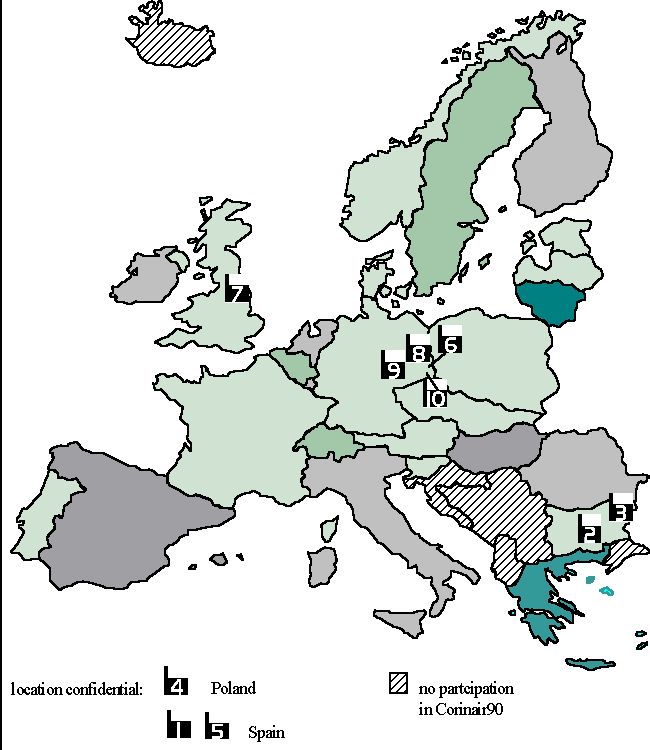
Map 2: The ten largest CO2
- emitting Public Power Plants in Europe 1990
Map 3: The ten largest NOX -
emitting Public Power Plants in Europe 1990


Document Actions
Share with others