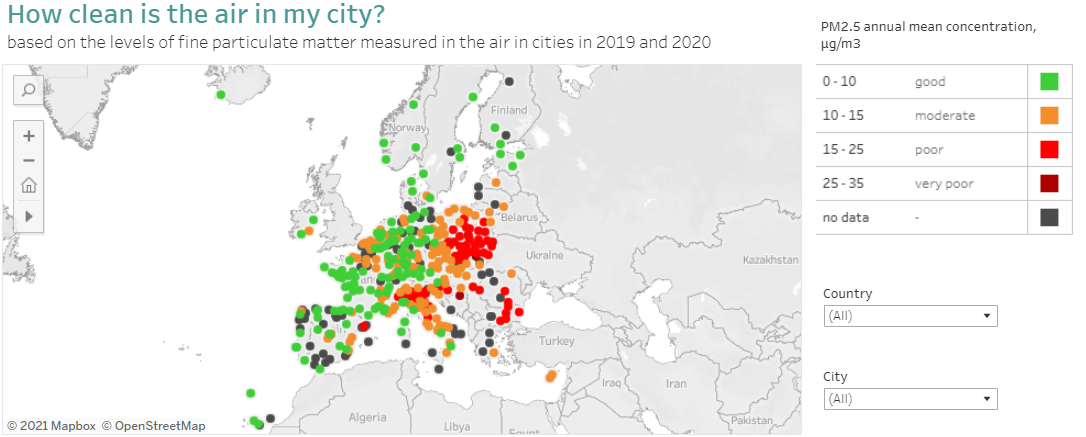
In the EEA’s new city air quality viewer, cities are ranked from the cleanest city to the most polluted, on the basis of average levels of fine particulate matter, or PM2.5, over the past two calendar years.
From 2019 to 2020, the top three cleanest cities in Europe in terms of air quality were Umeå in Sweden, Tampere in Finland and Funchal in Portugal. The three most polluted were Nowy Sacz in Poland, Cremona in Italy and Slavonski Brod in Croatia.
Of the 323 cities included in the viewer, air quality in 127 cities is categorised as good, meaning that it falls below the health-based guideline for long-term exposure to PM2.5 of 10 micrograms per cubic meter of air (10 μg/m3) established by the World Health Organization (WHO).
The European Union has set an annual limit value for PM2.5 of 25 μg/m3 under policies to deliver clean air in Europe. The viewer rates the long-term air quality as very poor when PM2.5 levels are at or above this threshold, with five cities in Poland, Croatia and Italy falling in this category.
Fine particulate matter is the air pollutant with the highest impact on health in terms of premature death and disease. The viewer provides information on long term air quality in each city. Long term exposure to PM2.5 causes cardiovascular and respiratory diseases.
While there has been a marked improvement in Europe's air quality over the past decade, the EEA’s latest annual air quality assessment found that exposure to fine particulate mater caused about 417,000 premature deaths in 41 European countries in 2018.
While air quality has improved markedly over the past years, air pollution remains stubbornly high in many cities across Europe. This city air quality viewer allows citizens to see for themselves in an easy-to-use way how their city is doing compared to others on air pollution.
It provides concrete and local information which can empower citizens towards their local authorities to address the issues. This will help all of us in achieving the EU’s zero pollution goals.
Hans Bruyninckx, EEA Executive Director

How the viewer works
The viewer provides data on the levels of fine particulate matter in over 300 cities across EEA member countries. It uses data reported to the EEA by its member countries under the EU’s Ambient Air Quality Directives. Data comes from ground measurements of PM2.5 taken by over 400 monitoring stations taken in urban and suburban areas within cities. These stations provide a robust picture of the exposure of the population to air pollution.
Readings and rankings are based on a the annual mean PM2.5 concentration over the past two calendar years, using up-to-date data for the most recent year and validated air quality data for the year before last. The table ranks European cities according to their average levels of fine particulate matter over the past two full calendar years. The EEA will in the future investigate incorporating other important air pollutants into the new tool.
The World Health Organization (WHO) has established a health-based guideline for long-term exposure to fine particulate matter of 10 micrograms per cubic meter of air (10 μg/m3). The European Union has set an annual limit value for fine particulate matter of 25 μg/m3 under policies to deliver clean air in Europe.
The viewer rates levels of air quality as:
- good for levels of fine particulate matter are under the annual guideline value of the WHO of below 10 μg/m3,
- moderate for levels from 10 to below 15 μg/m3;
- poor for levels from 15 to below 25 μg/m3; and
- very poor for levels at and above the European Union limit value of 25 μg/m3.
Please note that not all cities are included. The data set includes cities that are part of the European Commission’s Urban Audit and that have a population of over 50,000 inhabitants. Cities that do not have urban or suburban monitoring stations are not included, nor are those for which data from these monitoring stations covers less than 75% of days within a calendar year.
Other EEA air quality products
If you want to know what the air quality is in your city right now, please visit the European Air Quality Index. The index presents information on air quality over the past two days and a 24-hour forecast, together with health-based recommendations for short term exposure to air pollution. It also covers a broader range of air pollutants, including particulate matter, nitrogen dioxide, sulphur dioxide and ozone.
More information on the health impacts of air pollution in Europe is available here.
See here for the European Environment Agency’s latest annual report on air quality in Europe.
Document Actions
Share with others