16. Developments in indicators:
Total Material Requirement (TMR)
| indicator |
policy issue |
DPSIR |
assessment |
| Total Material Requirement
(TMR) |
decrease burden to global
environment due to resource extraction |
pressure |
— |
| domestic TMR |
decrease burden to domestic
environment associated with resource extraction |
pressure |
 |
| foreign TMR |
decrease burden to environment in
foreign countries |
pressure |
 |
| Direct Material Input (DMI) versus
GDP |
improve materials productivity
(processed materials only) |
response |
 |
Extraction of natural resources in EU
Member States declined by 12 % between 1985 and 1995, but imported
resources increased by 8 % between 1995 and 1997. The Direct
Material Input (DMI) in the economy fell by 8 % on a per capita
basis at the beginning of the 1990s, but then increased slightly.
In most Member States, economic growth has been associated with
increased DMI. However, Finland, France, Italy and the UK have
reduced their dependence on Direct Material Input.
The aim of this last chapter is to focus
on new developments in environmental indicators. In past years, a
number of aggregated physical measures have been proposed to show
overall pressures on the environment. Examples include the ‘human
appropriation of net primary production’ (indicating the share of
biomass used by human activities in energy units) and the
‘ecological footprint’ (indicating the area of productive land
utilised by a certain population and its activities). The new
indicator, Total Material Requirement (TMR), expresses the total
mass of primary materials extracted from nature to support human
activities. Thus, TMR is a highly aggregated indicator for the
material basis of an economy. This chapter presents the first
calculation of the TMR for the EU. The reader is invited to study
the outcomes and report back on the applications of this
indicator.
The TMR indicator includes both materials used
for further processing (Direct Material Input or DMI, see below)
and hidden flows, i.e. extractions that are not used further, but
have an environmental impact (e.g. overburden and extraction
waste). TMR includes extraction both from domestic territory and
ofthe resource requirements associated with imports. Changes in the
balance between the foreign and the domestic amount of TMR indicate
possible shifts in environmental impact between countries.
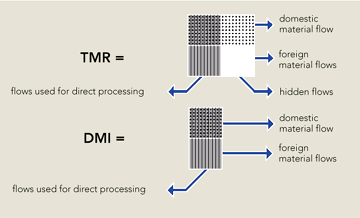
Similarly to energy requirements (see Figure
3.2) and total water abstraction (see Figure 12.2), TMR indicates a
generic pressure on the environment. The volume of resource
requirements determines the scale of local disturbances by
extraction (e.g. devastation of mining sites, disruption of natural
habitats, groundwater contamination and landscape changes at the
extraction site), the throughput of the economy (DMI) and
subsequent amounts of emissions and wastes. TMR, however, does not
indicate the severity of these specific environmental
pressures at the individual sites.
TMR consists of all resource extraction besides
water and air. Statistics on industrial production, agriculture,
forestry and fisheries provide data on domestic material
requirements, while foreign trade statistics give data on imports
(grouped into raw materials, intermediate products and final
products). Raw materials are traced back to the delivering
countries using these statistics. This data is supplemented by
specific information on hidden flows, e.g. overburden and
extraction waste in mining and quarrying, excavation during
construction and dredging, and erosion of agricultural fields.
Intermediate products are classified according to their main
constituent (e.g. steel or aluminium) and combined with data on
cumulative resource requirements. Final products are accounted for
only by their weight. The resulting values therefore represent
minimum estimates for the Total Material Requirement.
TMR comprises all the primary resources needed
for the production side of an economy, including trade and service
activities. All inputs contributing to value added are considered,
i.e. pure transit is not accounted for. Countries with a high
dependence on either domestic resource extraction or imports
exhibit high TMR values, irrespective of whether the resulting
produce is exported or consumed within the own country.
So far, TMR has been calculated only for a few
European countries (Bringezu and Schütz, 1995; Bringezu, 1997;
Adriaanse et al., 1997 and 1998; Juutinen and Mäenpää,
1999; Mündl et al.; 1999). Thefirst calculation of TMR for
the EU is presented and analysed below. Although the values are
preliminary, the order of magnitude appears sufficiently valid for
international comparisons.
16.1. Material resource requirements
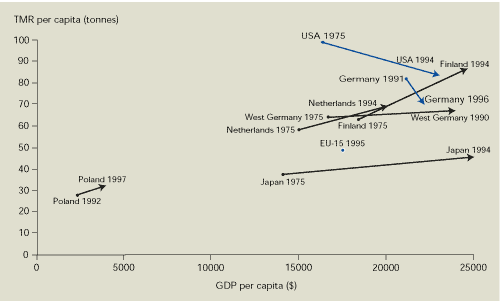
In 1995, the EU’s TMR amounted to 18.1 billion
tonnes or 49 tonnes per capita (Figure 16.1). Due to the masses of
materials involved and their hidden flows, the EU’s TMR is
dominated by energy, metals and mineral resources. It is
significantly lower than that for the US in 1994 (84
tonnes/capita), but higher than that for Japan (45 tonnes/capita)
in 1994. Both the US and Japan have a higher GDP per capita than
the EU. By comparison, GDP per capita for Poland was a fifth of
that for the EU in 1995, but the TMR per capita was almost 60 % of
that for the EU.
A time series of TMR for the EU will be
produced shortly. Until then two non-overlapping time series are
presented – one for the domestic and one for the foreign components
in TMR (Figures 16.3 and 16.4). In 1995, the domestic part
was 63 % of total EU material requirements, having fallen over the
previous 10 years. The remaining 37 % of TMR was linked to imports;
this value increased slightly between 1995 and 1997.
Figure 16.1: TMR and GDP of
the EU compared with selected Member States and other countries
Source: Wuppertal
Institute, WRI, NIES, VROM, Thule Institute, INE, Warsaw
University
Note: GDP
given at constant prices and exchange rates for 1990.
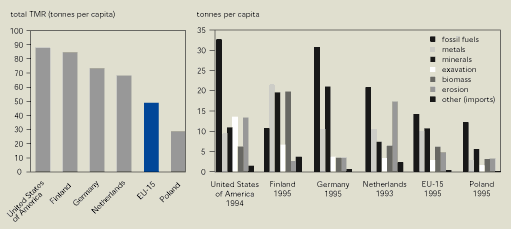
The main reason for the much lower total
resource requirements in the EU compared with the US is the
difference in material flows related to fossil fuels. Due to less
use of energy in the EU and a reduced use of coal, Europe’s
fossil-fuel resource requirements are only 44 % of the US’s (Figure
16.2).
Figure 16.2 also reveals differences in
national patterns of material requirements:
- Because Germany still depends to a large
extent on coal extraction, material flows related to fossil fuels
are the same order of magnitude as in the US.
- Germany and Finland have the highest
rate of minerals extraction due to sand and gravel production. The
German value for minerals is twice the EU’s due to significant
housing and infrastructure construction.
- In Finland, where metal manufacturing is
still a significant part of industrial production, resource
requirements for metals are relatively high. The relatively high
biomass values for Finland are due to forestry (timber is a
significant Finnish export).
- The high material flows associated with
erosion in the Netherlands reflect its significant agricultural
imports from non-European countries.
Figure 16.2: Composition of
TMR in the EU, selected Member States and other countries
Source: Wuppertal Institute, WRI, NIES, VROM,
Thule Institute, INE and Warsaw University
Note: Hidden
flows are included in fossil fuels, metals and minerals or are
represented by excavation and erosion.
16.2. Domestic resource extraction
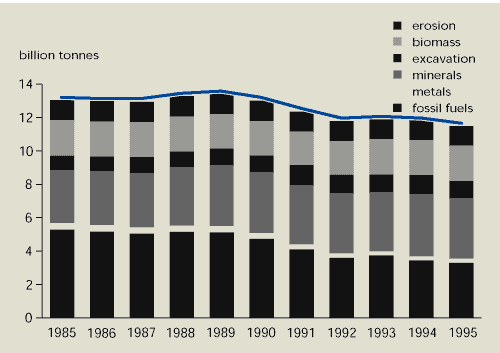
The domestic portion of TMR for the EU fell by
12 % between 1985 and 1995 to 63 %, mainly due to a decrease in the
extraction of fossil-fuel resources (Figure 16.3).
Figure 16.3:
Domestic resource extraction in the EU between 1985 and
1995
Source:
Wuppertal Institute
Note:
Before 1990, the values represent the combined extraction of the
former West Germany and East Germany.
 Domestic resource extraction in the EU fell by 12 % between
1985 and 1995, mainly due to a decline in lignite production in
eastern Germany.
The reduction was mainly due to a decline in
lignite production following the closure of significant numbers of
obsolete industrial facilities in eastern Germany since
reunification. However, lignite production still represented 80 %
of fossil-fuel-related domestic resource extraction in 1995 and was
associated with 23 % of the domestic TMR of the EU. The main
producers were Germany (74 % of EU lignite production), Greece (21
%), and Spain (4 %).
Extraction of hard-coal resources declined less
rapidly but still significantly compared with lignite – by 35 %
since 1985 to 135 million tonnes in 1995.In 1995, the main
producers of solid hard coal were Germany, the UK and Spain with 44
%, 38 % and 13 % respectively. However, in terms of total
extraction (including hidden flows), these countries accounted for
35 %, 24 % and 39 % respectively. Hard-coal production in Spain
thus has much higher hidden flows than Germany and the UK.
The decline in energy-resource extraction was
greatest for those energy carriers with the highest hidden material
flows. For lignite, an average of nine tonnes of overburden has to
be removed to extract one tonne of the energy carrier. This ratio,
which highlights the poor resource efficiency of lignite
production, has grown gradually. For hard coal, the ratio is much
lower (around 1:1), but is also increasing slowly. The ratios for
the other energy carriers are significantly lower. As lignite and
coal production decline, these highly resource-intensive energy
resources are being replaced by the less resource-intensive oil and
gas.
Simultaneously with this decline in domestic
material requirements for fossil fuels, the volume of mineral
requirements has grown and, in recent years, has exceeded domestic
energy resource extraction (Figure 16.3). Quarrying activities
should therefore be taken as seriously as mining activities. The
associated pressures on the environment associated with the overall
extraction volume, e.g. hydrological changes, habitat disturbances,
growth of built-up area and construction waste, have probably
increased as well.
For mineral resources, the proportion of hidden
flows is relatively low at 17.6 % of the total for mineral-resource
extraction.
16.3 EU resource requirements in foreign
countries
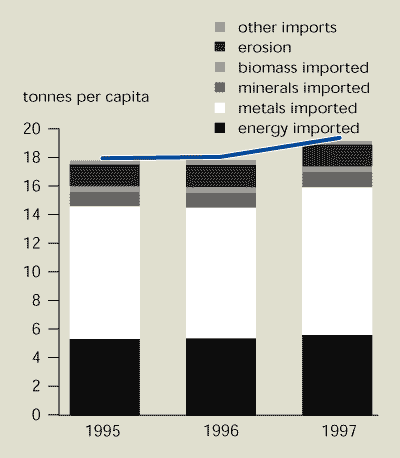
Imported metals, minerals and agricultural
products are associated with higher hidden flows per commodity than
domestic produce, indicating a relatively higher environmental
impact in the exporting countries. In 1995, the resource extraction
associated with EU imports was at least 37 % of TMR. Between 1995
and 1997, it increased by 8 % mainly due to the import of
precious-metal ores (Figure 16.4). Renewable resources account for
only 2.4 % of foreign TMR, compared with 18.3 % of domestic TMR.
Foreign TMR thus contributes particularly to the depletion of
non-renewable resources.
Figure 16.4:
TMR of the EU associated with imports
Source:
Wuppertal Institute
Note: Foreign resource extraction as a basis for domestic
activities.
 EU material requirements for foreign resources increased by 8
% between 1995 and 1997. Demand for luxury and precious commodities
has a major influence on foreign TMR.
Imports of precious-metal ores into the EU
increased by 51 % between 1995 and 1997 to 5 600 tonnes/year. In
1997, resource flows of precious metals (an estimated 1.5 billion
tonnes) contributed around 70 % to metal-resource extraction for
imports to the EU while iron and copper ore, the second- and
third-ranked metal imports, contributed only 18 % and 4 %
respectively. Imports of finished products such as jewellery,
plated ware, gold and silver goods also contribute to resource
requirements. These have not yet been included in foreign TMR data
for the EU, but are estimated to contribute an additional 1
tonne/capita.
Diamond imports dominate mineral requirements.
Imports of only 44 000 kg in 1997 were linked to an estimated
extraction of 232 million tonnes of material. This is more than
half the mineral-resource requirements of the EU’s foreign TMR. The
hidden flows associated with the import of 2 450 tonnes of other
precious stones in 1997 have not yet been quantified due to lack of
data.
The inevitable conclusion from the data above
is that much of the resource flows for EU imports are associated
with luxury commodities.
There is a marked difference in the hidden flow
to commodity ratios for domestic resource extraction and foreign
resource extraction (Table 16.1).
| Table 16.1 Ratios
of hidden flows to commodities for the EU in 1995 |
| |
Domestic |
Foreign |
Total |
| Fossil fuels |
3.48 |
1.63 |
2.55 |
| Metals |
1.07 |
15.49 |
10.34 |
| Minerals |
0.21 |
4.41 |
0.31 |
| Agricultural biomass |
0.63 |
5.90 |
0.89 |
| Total |
0.94 |
4.18 |
1.51 |
| Source: Wuppertal Institute |
|
|
|
Fossil-fuel imports (other than electricity)
have a significantly lower hidden-flow ratio than domestic
extraction of energy resources. Imports are mainly oil and natural
gas, and have lower hidden flows than lignite and hard coal.
Reducing energy use by industry, transport and households will mean
less burden on the environment from resource extraction either
domestically or in foreign countries.
Hidden flows from the import of metal resources
are 14 times higher than those from domestic extraction. Ore mining
is only a minor activity within the EU, which imports most of its
base metals (iron, aluminium, copper, etc.) and almost all its
precious metals.
Imports of agricultural products by EU Member
States are associated with more erosion than domestic agriculture.
This is mainly due to the import of products such as coffee and
cocoa. In a number of Member States, consumers have shown some
interest in supporting more sustainable agricultural practices by
buying specific and labelled products.
16.4. Resource productivity of ‘Direct Material
Inputs’
Calculation of TMR requires connecting
production and import statistics with coefficients for the hidden
flows. Production of a time series of Direct Material Inputs
(DMIs), i.e. inputs of primary materials without the hidden flows,
would be much easier and would give a straightforward and
up-to-date indicator for trends in resource productivity. When
comparing countries for which TMR and DMI have been calculated,
there is an indication that a high DMI goes with a high TMR and
vice versa. If such a correlation could be proved, the more easily
calculated DMI could be used for regular monitoring of materials
productivity. A full domestic TMR would then only need to be
calculated if the burden of resource extraction to the national
environment was required. In addition, foreign TMR can be used to
indicate the sharing of burdens and the shifting of problems
between countries and regions.
The DMI of the EU showed a moderate reduction
in absolute terms of 6 % between 1988 and 1995 (Figure 16.5). On a
per-capita basis, it declined by 8 % from 21.2 tonnes/capita to
19.5 tonnes/capita. Most of the change occurred at the beginning of
the 1990s and was mainly due to a decline in imports of 1
tonne/capita. Since 1993, however, the DMI of most EU Member States
has been increasing slightly. Thus in terms of DMI, there is no
sign of an absolute decrease in material use.
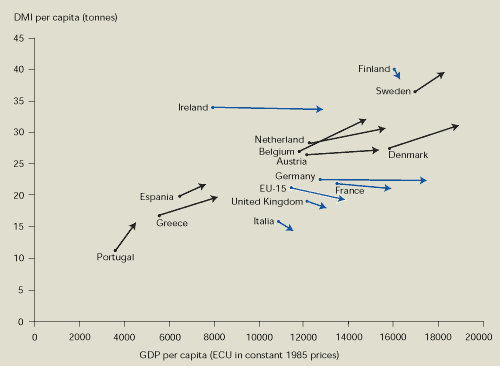
When comparing DMI and GDP for EU Member States
between 1988 and 1995, three groups of Member States can be
distinguished:
- A higher economic performance is
associated with higher DMI in Austria, the Benelux countries,
Denmark, Greece, the Netherlands, Spain, Sweden and Portugal.
- Germany and Ireland achieved
significantly higher GDP with a constant DMI. In these two Member
States, a relative decoupling of direct material requirements and
economic growth has occurred.
- Finland, France, Italy and the UK
managed to combine economic growth with reduced DMI. Reduced
extraction of building minerals allowed these four Member States to
demonstrate that absolute dematerialisation is possible.
The EU as a whole performed well with a
reduction of DMI/capita by 8 % while GDP/capita increased by 19 %.
Altogether direct materials productivity grew by 29 % in the EU
between 1988 and 1995. The difference in EU results compared with
those of individual countries is due to the exchange of goods
between the countries: Member States’ DMIs include intra-EU trade
whereas the EU’s DMI does not. Due to the constant level of DMI
since 1992, the EU as a whole can be grouped with Germany and
Ireland (group 2) . leaving it the challenge of following the
countries in group 1 to use less material resources while achieving
a higher economic performance.
Figure 16.5:
Direct Material Input versus GDP per capita in EU Member States,
1988-1995
Source:
Wuppertal Institute
Notes: GDP in ECU at constant prices of 1985. DMI of Member
States includes intra-EU trade, but the DMI of the EU does
not.
 Direct resource productivity of the EU increased by 29 %
between 1998 and 1995.
16.5. References and further reading
Adriaanse, A., et al. (1997).
Resource flows: the material basis of industrial economies.
Eds: World Resources Institute Wuppertal Institute; Netherlands
Ministry of Housing, Spatial Planning, and Environment; National
Institute for Environmental Studies, Japan. WRI Report,
Washington.
Adriaanse, A., et al. (1998).
Stoffströme: Die materielle Basis von Industriegesellschaften
(German revised version of Adriaanse et al. 1997). Eds.:
Wuppertal Institute; World Resources Institute; Netherlands
Ministry of Housing, Spatial Planning, and Environment; National
Institute for Environmental Studies, Japan. Wuppertal Texte,
Birkhäuser Verlag, Basel.
Bringezu, S. (1997). ‘Accounting for the
physical basis of national economies: material flow indicators’ in
SCOPE 58 — Sustainability Indicators: 170-180 B. Eds.
Moldan et al.
Bringezu, S. and Schütz, H. (1995). ‘Wie mißt
man die ökologische Zukunftsfähigkeit einer Volkswirtschaft? — Ein
Beitrag der Stoffstrombilanzierung am Beispiel der Bundesrepublik
Deutschland’ in Neue Ansätze der Umweltstatistik: 26-54.
Ed. S. Bringezu.
Juutinen, A. and Mäenpää, I. (1999). Time
Series for the Total Material Requirement of Finnish Economy —
Summary. Eco-efficient Finland project, interim report 15
August 1999. University of Oulu, Thule Institute.http://thule.oulu.fi/ecoef
Mündl, A. et al. (1999).
Sustainable development by dematerialization in production and
consumption — strategy for the new environmental policy in
Poland. Report 3, 1999. Institute for Sustainable Development,
Warsaw.


Document Actions
Share with others