4. The energy sector
| indicator |
policy issue |
DPSIR |
assessment |
| thermal power plant energy
efficiency |
has the sector improved the
overall efficiency of its main process? |
driving force |

|
| energy sector emission
intensity |
has the sector succeeded in
de-linking emissions from its economic activity? |
pressure |

|
| electricity supply by source |
has the sector become less
dependent on fossil fuels? |
driving force |

|
| renewables' share of electricity
generation |
... and increased the share of
renewable energy? |
driving force |

|
| CHP share in electricity
generation |
... and explored all possibilities
for combined heat and power? |
driving force |

|
Fossil fuels (coal, oil, gas) are still the
predominant energy source for electricity production. Nuclear power
is an important source in a number of EEA countries. Despite recent
high growth rates in wind and solar power in a few Member States,
renewable energy sources contribute little to electricity
generation. Hydro power (mostly large hydro plants) remains the
main renewable energy source. Use of combined heat and power (CHP),
despite significant developments in a small number of Member
States, remains low compared to the EU target.
Electricity generation is the energy sector's
main activity, with almost half the electricity produced in thermal
power plants using fossil fuels. The overriding driver in the
sector is EU and national policy to liberalise energy markets and
to encourage competition. Increased competition could result in
more efficient generating technologies. However, any environmental
benefits associated with this development could be offset as
increased competition may reduce energy prices. This, in turn, may
increase the demand for energy and thus increase emissions. Within
these macro developments, and given the current growth in energy
consumption, an important internal aim for the sector is to
increase the environmental efficiency of its own production.
4.1. Energy sector eco-efficiency
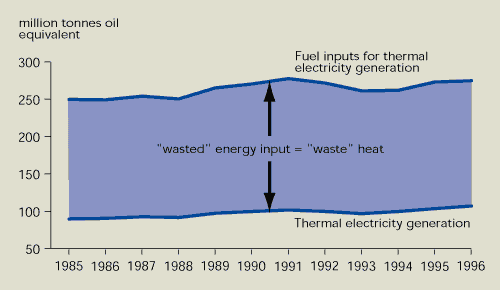
The efficiency of conventional thermal
electricity generation showed only a gradual improvement from 36 %
in 1985 to 39 % in 1996, mainly due to `business-as-usual'
improvement and replacement of installa tions (Figure 4.1). In
other words, about 60 % of energy input is `lost' as heat during
the process of producing electricity. Not all the heat produced is
wasted, as some waste heat is used in local applications.
Additionally a few countries have invested in combined heat and
power plants for district heating and industrial use (see
Figure 4.6). Given the limited size of these applications, the
order of magnitude of energy losses in the EU does not change much.
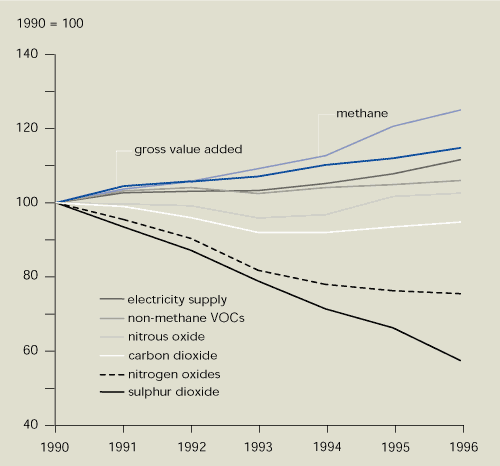
Limited efficiency improvements mean that end-of-pipe treatment and
process changes (including fuel switching) have produced most of
the reduction in the sector's environmental impact. Until now, this
approach has proved successful for most traditional air pollutants,
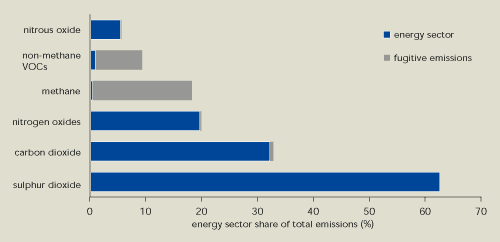
but not for carbon dioxide (Figure 4.2). The energy sector has an
important role to play in solving climate change and acid rain
issues as it is the main source of sulphur dioxide emissions and a
significant source of carbon dioxide and nitrogen oxide emissions
(Figure 4.3).
Figure 4.1. Thermal power
plant energy efficiency in EU Member States
Source:
Eurostat
Notes:
Thermal power generation is defined as the process of electricity
production using combustible fuel sources (coal, natural gas, oil,
waste or biomass) or existing heat sources (geothermal
energy).
 The average efficiency of
thermal power plants is increasing steadily, but slowly.
Figure 4.2. Energy sector
eco-efficiency, EU Member States
Source: EEA-ETC/AE; NTUA
Notes:
Emissions from public electricity and heat production, petroleum
refining and the manufacture of solid fuels. This definition of the
energy sector corresponds to the 1A1 energy industries category
under the IPCC reporting framework. As defined here, the energy
sector does not include fugitive emissions. When fugitive emissions
from the exploration, production, storage and transport of fuels
are taken into the account, methane levels fall both relative to
gross value added and in absolute terms.
 Although the link between acid gas emissions
(sulphur dioxide and nitrogen oxide) and the energy sector's
economic and electricity outputs has been broken, greenhouse gas
emissions from the sector have at most fallen only
slightly.
The decline in sulphur dioxide emissions
(Figure 4.2) has been partly due to the Large Combustion Plant
Directive, which sets limits on emissions of sulphur dioxide,
nitrogen oxides and particulates from power stations and has led to
a number of technical improvements. In addition, the shift from
coal to gas for electricity production contributed to the reduction
in carbon dioxide emissions and also the reduction in acid gas
emissions. The shift from coal to gas was due to the increased
availability of gas supplies, legislative changes in the EU and in
some Member States to allow gas to be used for electricity
generation, the reduction of coal subsidies in a number of Member
States, and the liberalisation of EU electricity and gas markets.
Restructuring of the power sector in the former east Germany also
contributed to reductions in carbon dioxide and acid gas
emissions.
The Integrated Pollution Prevention and Control
(IPPC) Directive requires plants to use Best Available Techniques
(BAT) to tackle pollution, and thus may help to further reduce
emissions from the sector. However, the Directive has just come
into force for new plants, and will take effect for existing plants
only in 2007.
Figure 4.3. Energy sector's
share of total emissions in EU Member States, 1996
Source: EEA-ETC/AE
Notes:
Emissions from public electricity and heat production, petroleum
refining and the manufacture of solid fuels. This definition of the
energy sector corresponds to the 1A1 energy industries category
under the IPCC reporting framework. As defined here, the energy
sector does not include fugitive emissions. Fugitive emissions
include here emissions from the exploration, production, storage
and transport of fuels.
The energy sector also produces significant
amounts of waste, and past activities have resulted in soil
contamination. The sector is a major user of natural resources: the
fossil fuels themselves, water for cooling (see Figure 12.3), hydro
power, land and raw materials. Nuclear power plants have the risk
of nuclear accidents and subsequent radioactive releases, and also
generate radioactive waste. Water pollution and wastewater
discharges are other issues for the sector.
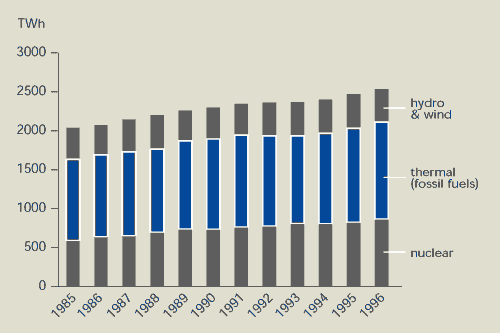
Figure 4.4. Electricity
supply in EEA member countries
Source: DG Energy
Notes:
Fossil fuels are the main fuels for thermal production of
electricity. Less than 5 % of thermal electricity is produced from
biomass and geothermal sources.
 Fossil fuels remain the predominant source of fuel for
thermal power. Nuclear power, with its particular environmental
impacts and risks, has become an increasingly important source of
electricity in a number of EEA member countries.
4.2. Trends in the electricity
sector
In 1996, 48 % of the electricity in EEA member
countries was generated by thermal power (mainly using fossil
fuels), 34 % by nuclear power and the remainder by hydro and wind
power (mostly hydro) (Figure 4.4). The figures for the EU are
52 % and 35 % respectively.
Austria, Portugal and Sweden have the highest
contribution of renewables in their electricity generation
(Figure 4.5), while Sweden, France and Italy contribute the
greatest share to total EU generation of electricity from renewable
energy sources. Hydro power is by far the largest renewable energy
source for electricity generation in the EU. Most hydro power is
produced in large plants, which can have considerable impacts on
ecosystems.
Significant progress in the production of
electricity from wind and solar sources has been made, such as wind
power in Denmark and Germany. However, the actual contribution of
`green' electricity remains far short of its potential and more
could be done in the renewables electricity sector to help reach
the EU target of 12 % of gross inland energy consumption produced
by renewable energies by 2010.
Figure 4.5. Renewables'
share of electricity generation in EU Member States, 1996

Source: DG Energy
 Renewable energy sources
generate significant quantities of electricity in only a few EU
Member States. Wind power, despite recent high growth rates,
contributes only marginally in a few Member States. Solar power
contributes even less.
CHP generated only 10 % of the electricity in
EU Member States in 1996. Targets for increasing combined heat and
power (CHP) generation have been set by the EU and some Member
States; the EU target for 2010 is an 18 % share for CHP in EU
electricity production. Several Member States use CHP extensively —
notably Denmark, Finland and the Netherlands, and to a lesser
extent Austria (Figure 4.6).
Figure 4.6. CHP's share of
electricity generation in EU Member States, 1996
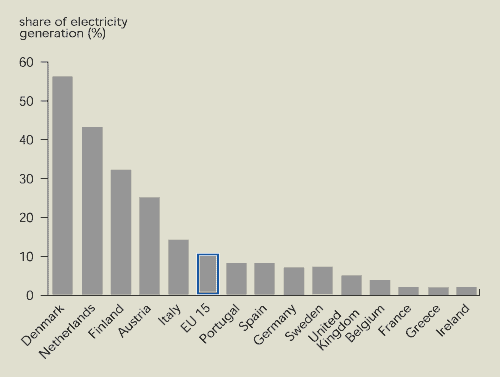
Source: Eurostat
 The use of combined heat and power (CHP) is significant
in a few EU Member States, but for the EU as a whole it is still
low compared with the EU target.
4.3. Indicator development
This chapter focuses mainly on power
generation. Analysis of refineries, an important part of the
sector, would provide a more complete overview of the energy
sector. While data availability is generally good, the response
indicators for combined heat and power, renewable energies, use of
price mechanisms and energy efficiency, and analysis of their
effectiveness in reducing environmental impacts need further
attention.
For the future, indicators on the sector's
generation of waste, use of natural resources, water pollution and
wastewater discharges also need to be considered.
4.4. References and further reading
European Commission, DG Energy (1998).
Energy in Europe, 1998 annual energy review, special issue.
European Commission, Brussels.
European Commission (1997). A Community
strategy to promote combined heat and power (CHP) and to dismantle
barriers to its development. COM (97)514 final. European
Commission, Brussels.
IEA/OECD (1999). International Energy
Agency/OECD balances 1996-97. International Energy
Agency/OECD, Paris.
| Empowered customers |
| Most people enjoy a long hot soak in the
bath every now and then, but how many realise that just one bath a
week in addition to a daily shower adds 223 kWh to an average
household's annual energy bill?
Most people find it difficult to appreciate the
significance of these figures. Customers of Vattenfall AB, a
Swedish energy company, can now use models on the Web to calculate
their consumption and to simulate their household's impact on the
environment. Householders can then make an informed decision about
the level of environmental impact they cause.
Vattenfall offers its customers several
different kinds of electricity. As well as electricity produced
from mixed sources (the default option), customers can buy
electricity generated using wind and hydro power with different
levels of environmental certification.
Many Swedish householders and companies are
switching to environmentally certified wind- and hydro-generated
electricity, even though prices are slightly higher. Vattenfall
reports a five-fold increase in sales of wind power and a 2.5 times
increase in sales of hydro-generated electricity since June
1998.
Source: www.vattenfall.se; see
`huset'
|


Document Actions
Share with others