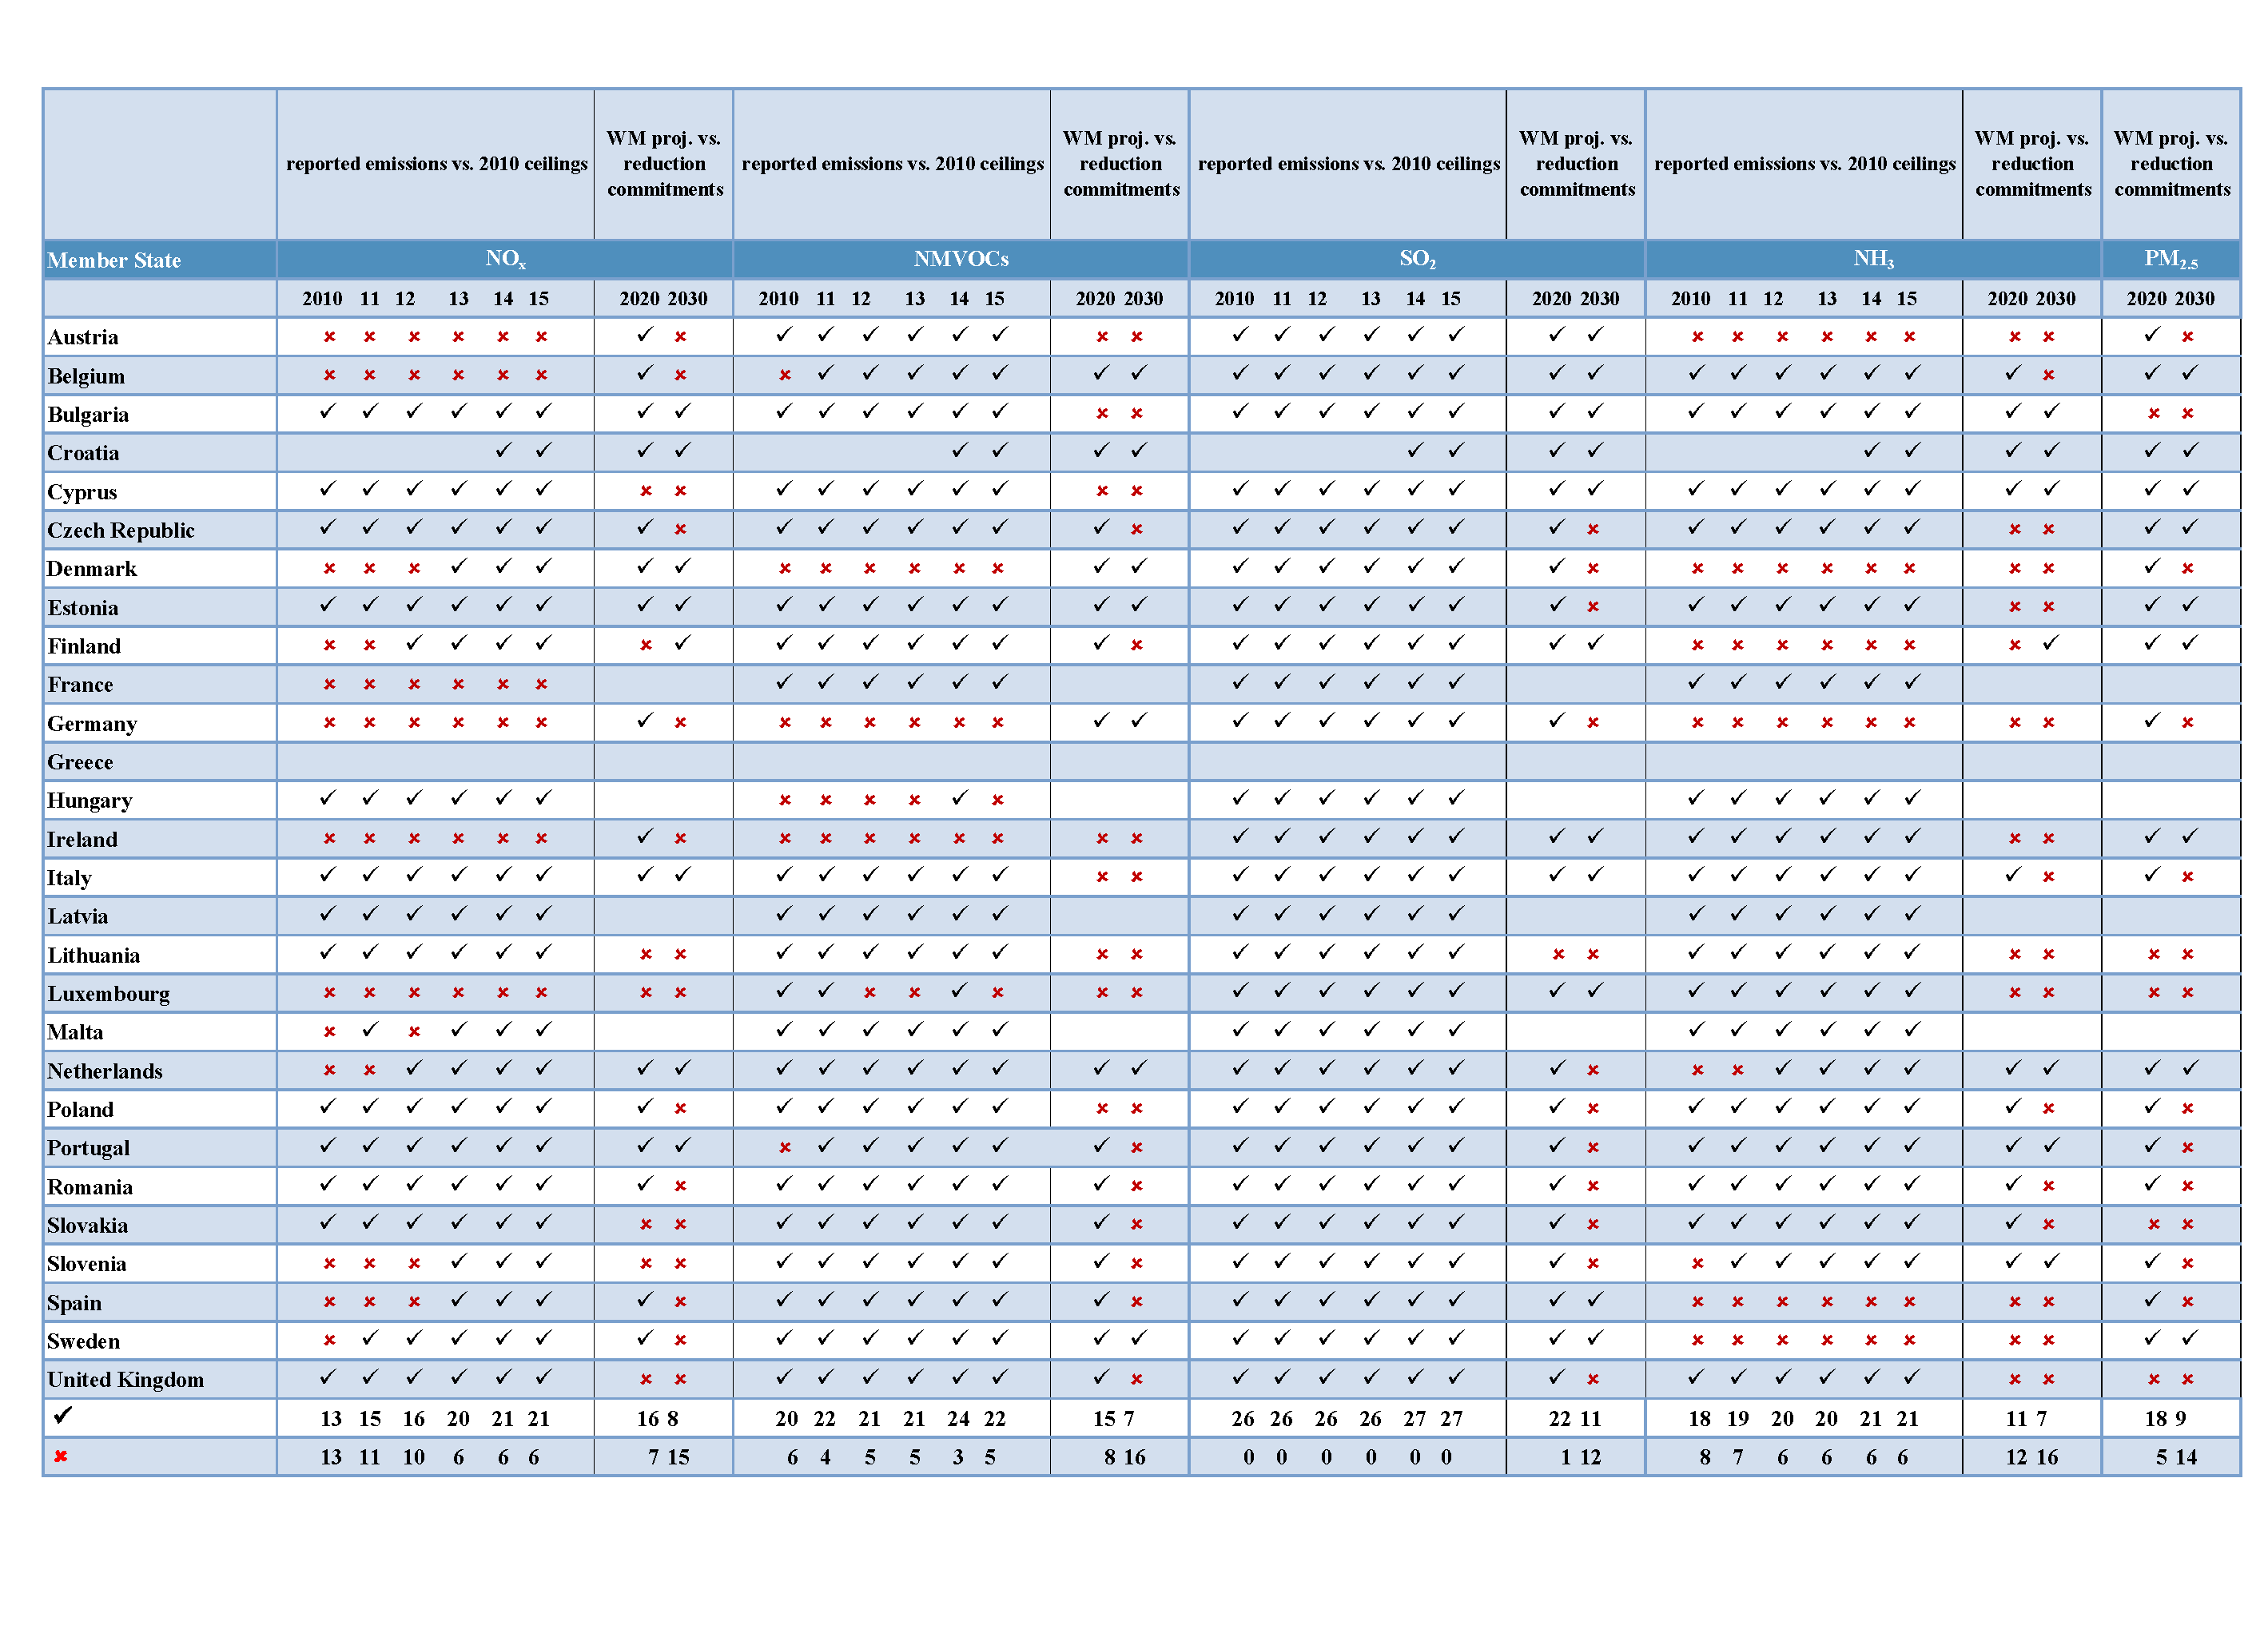
Comparison of Member State emissions with NEC Directive ceilings, and 2020 and 2030 emission reduction commitments
The new NEC Directive ensures that emission ceilings that had to be met by the year 2010 (as set in the 2001 NEC Directive) remain applicable until 2019, after which new emission reduction commitments for the years 2020 to 2029, and later 2030 onwards, become applicable. Under the new NEC Directive, Member States report each year emission inventory information for the past years (from 1990 (or 2000 in case of PM2.5) until the current year minus 2). Every second year emission projections for SO2, NOx, NH3, NMVOCs, PM2.5 and, if available, black carbon (BC) must be reported. The projections shall cover the years 2020, 2025, 2030 and, where available, 2040 and 2050. Projected emissions are used to assess whether or not Member States are on track towards meeting their reduction commitments for 2020 and 2030 (see Table 1).
Box 1: 'Adjustments' to emission inventories under the new NEC Directive
Consistent with a similar procedure agreed to by Parties under the Gothenburg Protocol of the LRTAP Convention, the new NEC Directive establishes a process that allows Member States to ‘adjust’ the reported emissions in their emission inventories downwards if exceedances of the national ceilings are caused by countries having applied improved emission inventory methods in accordance with updated scientific knowledge since the time the 2010 ceilings were originally set.
Member States wishing to adjust their data in this way must first notify the European Commission (by 15 February of each year), and subsequently submit a range of documentation (by 15 March each year) for review by the Commission. Reviews of the adjustment applications submitted in 2017 have not yet been finalized and therefore cannot yet be considered as ‘official’ data. Thus, the data provided in this briefing are based on unadjusted emission totals, and the number of exceeded ceilings shown for Member States in Table 1 will be lower if the adjustment applications are approved.


Source: National Emission Ceilings (NEC) Directive emission inventory data
Notes:
' ' indicates that the emission ceiling or reduction commitment has been, or is anticipated to be, attained. The 2001 NEC Directive does not include a 2010 ceiling for PM2.5.
' ' indicates that the ceiling or reduction commitment has not been, or is not anticipated to be, attained.
Greece did not report data in 2017.
The comparison with current emission ceilings is calculated based on unadjusted emissions. Following a review of submitted adjustment applications by the European Commission, and if approved, the number of Member States exceeding one or more emission ceilings in 2015 would decrease from 11 to 5, with emissions from Belgium, Denmark, Finland, France, Ireland and Luxembourg now being below all of their respective ceilings. Austria would be very close to meeting all of its ceilings. Germany and Spain would still exceed their NH3 ceilings.
The WM or 'with measures' projection is calculated by Member States on the basis of adopted policies and measures currently in place. For assessing attainment with the 2020 and 2030 reduction commitments, for each Member State NOx and NMVOCs emissions from the two main agricultural activities, manure management (3B) and agricultural soils (3D), are subtracted, as required by the new NEC Directive.
Six Member States reported besides the WM projections also 'with additional measures' (WAM) scenarios that reflect adopted as well as planned measures: Germany, Croatia, Ireland, Lithuania, Romania and Slovakia. If these WAM projections are compared with the 2030 reduction commitments, results indicate that some countries consider themselves on track towards meeting their commitments for some pollutants.
Nitrogen oxides (NOx)
Six Member States exceeded their NOx emission ceilings in 2015. Austria, Luxembourg, Ireland and Germany exceeded their NOx ceilings the most, in percentage terms, by 28 %, 19 %, 13% and 13 %, respectively. In absolute amounts, the largest emitters of NOx in 2015 were Germany, the United Kingdom and Spain. Between 2014 and 2015, 20 Member States reported emission reductions for NOx. The total reduction for the aggregated EU emissions amounts to −2.1 % between 2014 and 2015.
Non-methane volatile organic compounds (NMVOCs)
In 2015, six Member States (Denmark, Germany, Hungary, Ireland, Luxembourg and Portugal) did not attain their ceilings. The highest exceedance in 2015, in percentage terms, was reported for Ireland (84 %). This is due to the recent addition of NMVOC emissions from agriculture into the country's emission inventory. The largest emitters of NMVOCs in 2015 were Germany, Italy and United Kingdom. Between 2014 and 2015, 10 Member States reported emission reductions for NMVOCs. The aggregated EU emissions increased by just 0.5 % between 2014 and 2015.
Sulphur dioxide (SO2)
All Member States complied with the emission ceilings for SO2. The largest emitters of SO2 were Poland, Germany and Spain. Between 2014 and 2015, 19 Member States reported emission reductions for SO2. The total reduction for the aggregated EU emissions amounted to –6.1 % between 2014 and 2015.
Ammonia (NH3)
Six Member States (Austria, Denmark, Finland, Germany, Spain and Sweden) exceeded their NH3 ceilings in 2015. The highest exceedances, in percentage terms, were reported for Germany (38 %) and Spain (34 %). The smallest exceedance was reported for Austria (1 %). The largest emitters of NH3 were Germany, France and Spain. Between 2014 and 2015, eight EU Member States reported emission reductions for NH3. For the second consecutive year, EU emissions of NH3 increased, by 1.7 % between 2014 and 2015.
EU progress in meeting its emission ceilings and comparison with future emission reduction commitments
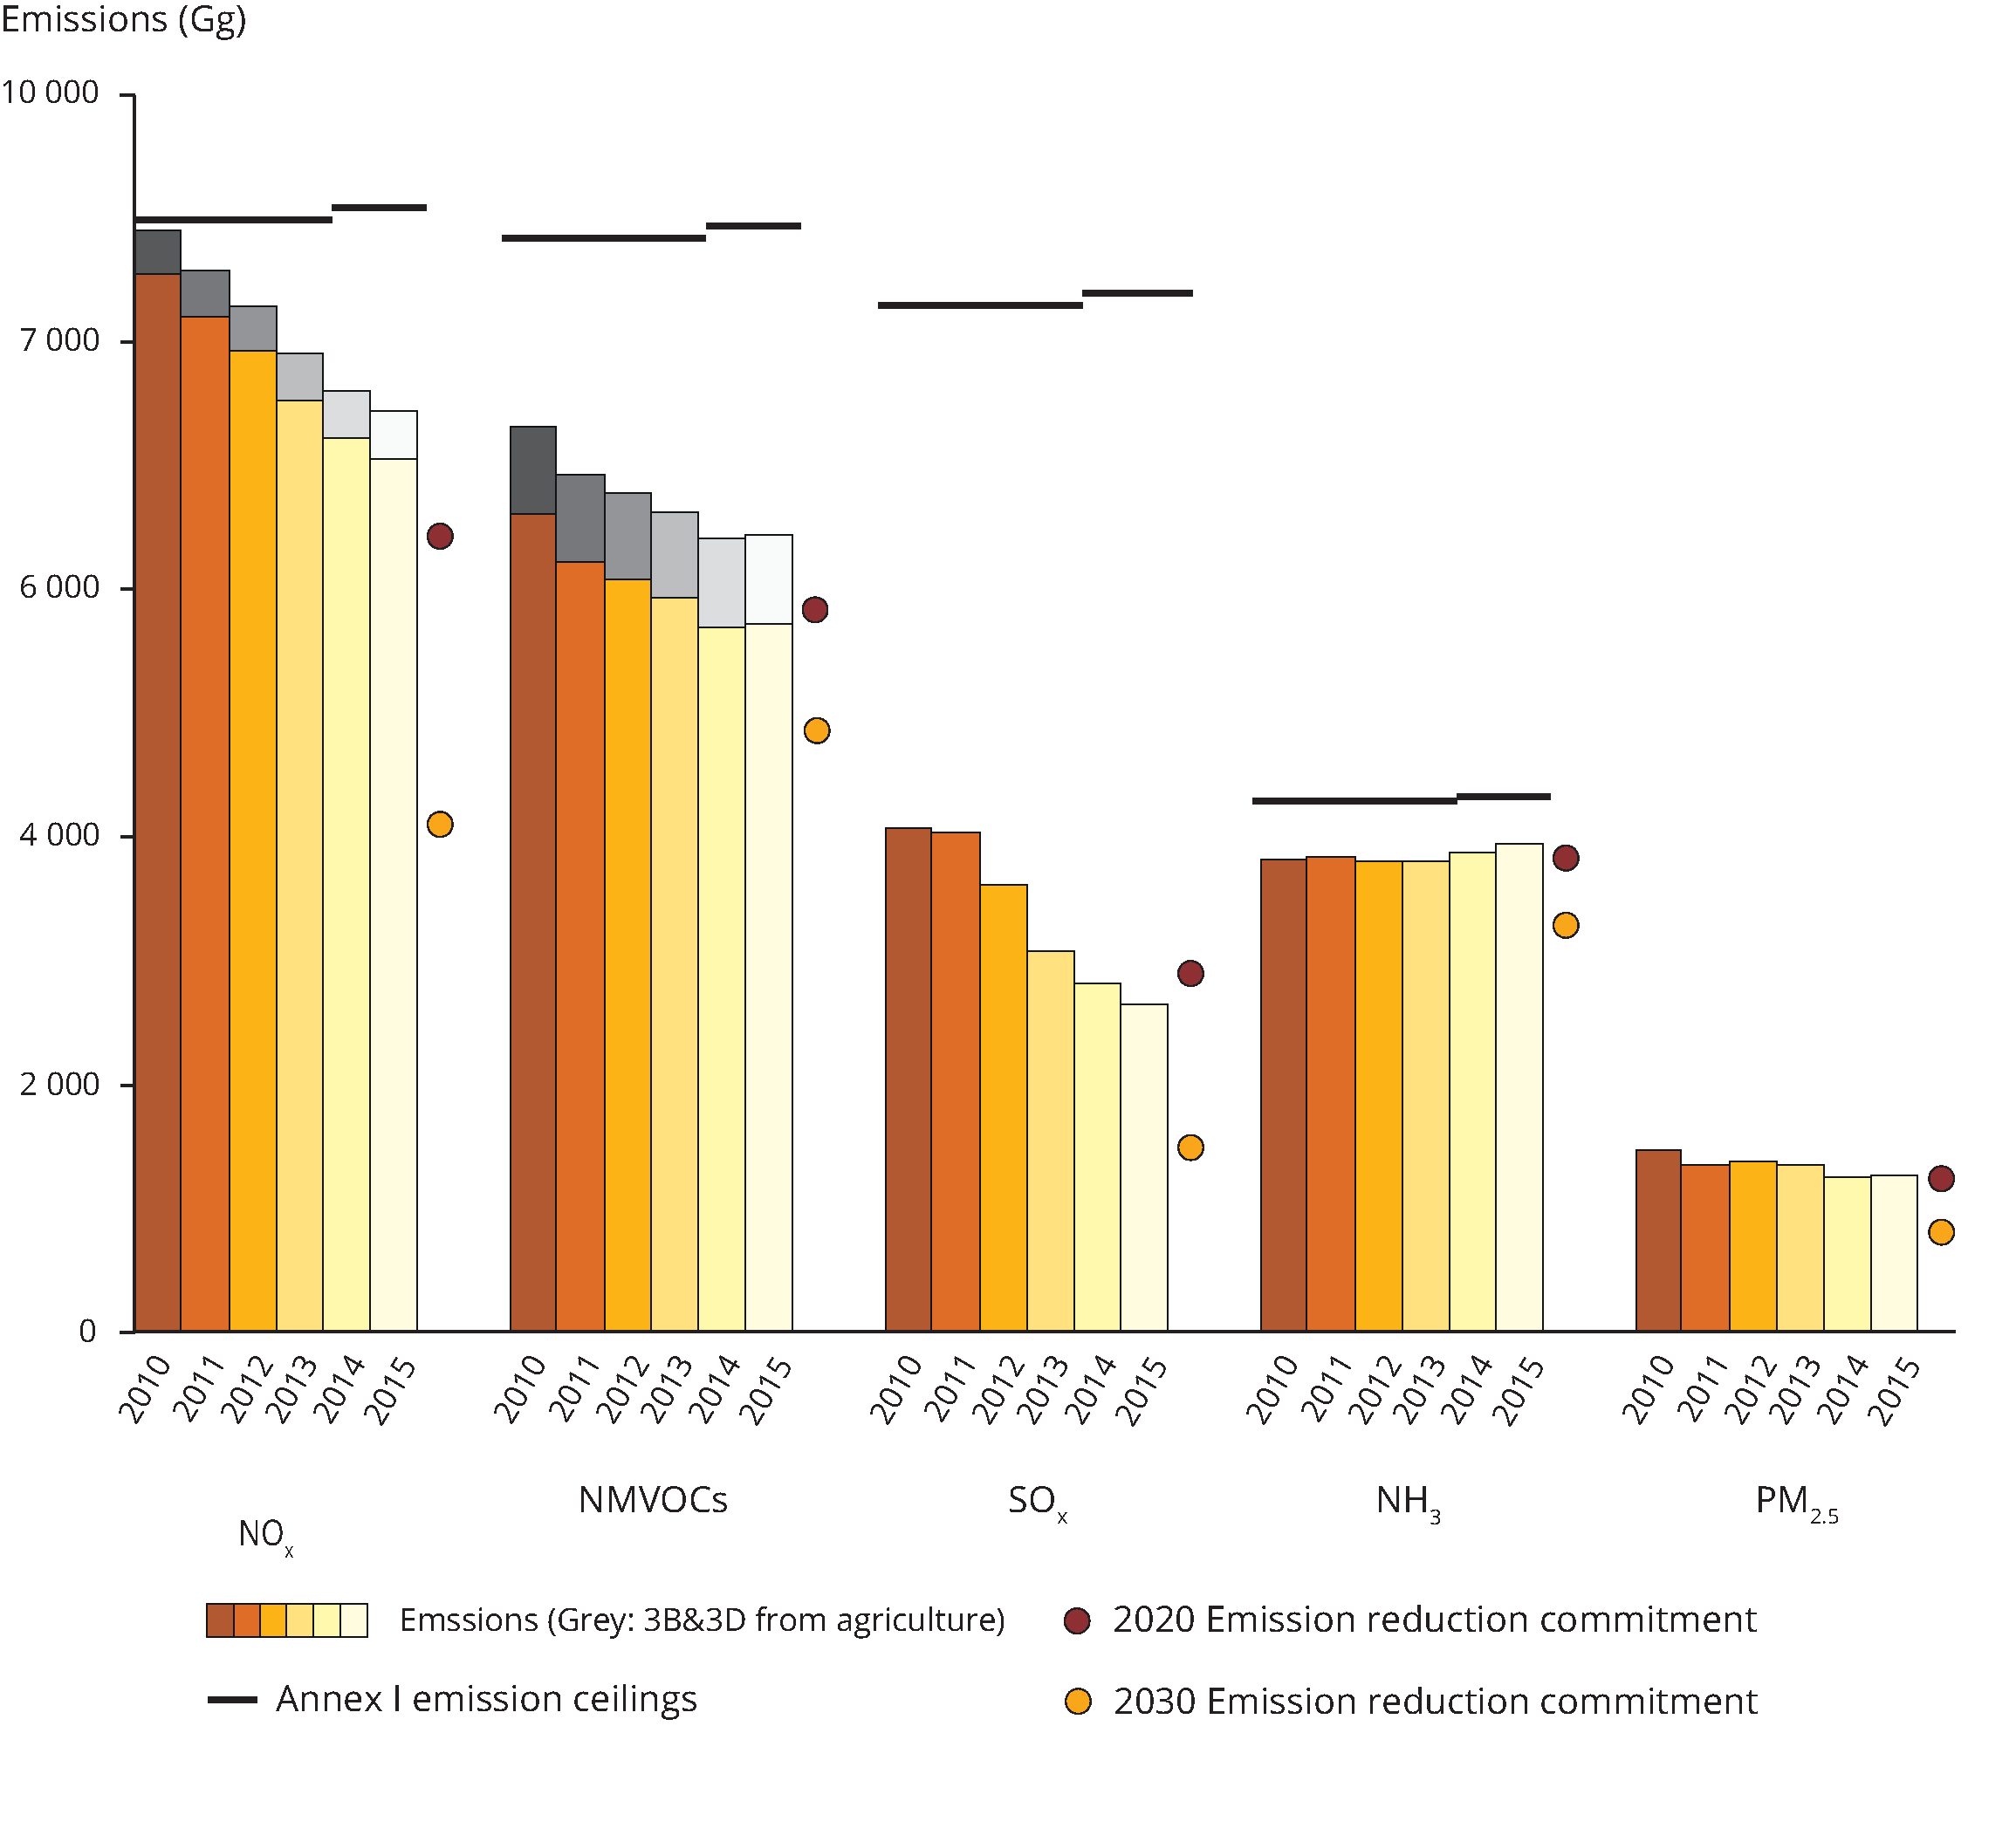
Under the new NEC Directive, the EU must until 2019 continue to meet the aggregated 2010 emission ceilings for four key pollutants, NOx, NMVOCs, SO2 and NH3. In each year since 2010, the total EU emissions of these pollutants were below the respective ceilings (Figure 1). In 2015, EU total emissions of NMVOCs and SO2 were already below the 2020 reduction commitments set for these pollutants. Only for NOx a further, more significant, reduction is required in order to meet the 2020 commitment — emissions need to be reduced by a further 9 % compared with 2015 levels. In contrast, more substantial reductions are needed for all pollutants if the EU is to achieve its 2030 emission reduction commitments (i.e. NOx a reduction of 42 % compared to 2015 emissions, NMVOCs 15 %, SO2 44 %, NH3 16.4 % and PM2.5 36 %).

Notes:
Croatia joined the EU in mid-2013; therefore, for the years 2010-2013 emissions and ceilings are not considered for this country. Greece did not report data in 2017; therefore, the aggregated EU emissions are incomplete.
The distance to ceilings was calculated based on unadjusted emissions.
The 2001 NEC Directive does not include 2010 ceilings for PM2.5. The EU's 2020 and 2030 reduction commitments are calculated relative to 2005 base year emissions.
For assessing future attainment with the 2020 and 2030 reduction commitments, NOx and NMVOCs emissions from two main agricultural activities, manure management (3B) and agricultural soils (3D) are not considered. The magnitude of these emission sources is indicated by the top part of the NOx and NMVOC columns. Thus only the lower part of the NOx and NMVOCs columns should be considered for comparing with the 2020 and 2030 reduction commitments.
Reasons for exceedances of emission ceilings
NOx emissions from road transport contribute 39 % of the EU emissions total. They are one of the main reasons for the large number of NOx exceedances since 2010. NOx reductions from this sector have been lower than originally anticipated over the past two decades, partly because transport has grown more than expected, and partly owing to the larger than expected growth in the number of diesel vehicles that produce higher NOx emissions than petrol-fuelled vehicles. The high 'real-world emissions' of NOx, particularly from diesel passenger cars and vans, have contributed significantly to the share of emissions caused by the road transport sector. The EU's annual air quality limit value for nitrogen dioxide (NO2) is widely exceeded across Europe, and more than 90 % of the values above the annual limit value can be observed at traffic monitoring stations (EEA, 2016).
Six Member States continue to exceed their respective NH3 ceilings. 94 % of NH3 emissions come from agriculture, mainly from the handling of animal manure and the use of fertilisers. NH3 emissions have decreased since 1990, but not to anywhere near the same extent as the other pollutants covered by the NEC Directive. A number of technical measures exist to reduce NH3 emissions. A main reason for the high or even rising NH3 emissions in some countries is an increasing number of pig or poultry facilities, without implementing measures and/or technologies to limit emissions. NH3 emissions from agriculture contribute to the formation of PM2.5 in the atmosphere and can contribute to high-PM episodes in Europe. NH3 (and NOX) emissions also contribute to an oversupply of airborne nitrogen in sensitive ecosystems, reducing for example 'species richness' in nutrient-poor grasslands (EEA, 2016).
 ' indicates that the emission ceiling or reduction commitment has been, or is anticipated to be, attained. The 2001 NEC Directive does not include a 2010 ceiling for PM2.5.
 ' indicates that the ceiling or reduction commitment has not been, or is not anticipated to be, attained.
Document Actions
Share with others