next
previous
items

3.4.2. Other

In this chapter, a brief description is given of the following monitoring networks:

  • OSPAR, HELCOM, MEDPOL, GAW, TOR, GEMS/AIR

Some of the monitoring stations in these networks may be (probably are) the same as some of the regional stations described under each country in chapter 3.1/3.2. We have not, however, attempted to link these networks/stations to those described under each country previously.

  • OSPAR/CAMP

For 1994, data were reported for the following number of sites, and compounds (CAMP Secretariat, 1995):

Precipitation:
25 sites in 10 countries
Priority compounds : Cd, Hg, NO3, NH4
Grey list : As, Cr, Cu, Ni, Pb, Zn, organo-halogens.

Aerosols and gases:
12 stations in 6 countries
Priority compounds: Cd, Hg, a-HCN, g-HCN, HNO3, NO3, NO2, NO, NH3, NH4
Grey list: As, Cr, Cu, Ni, Pb, Zn.

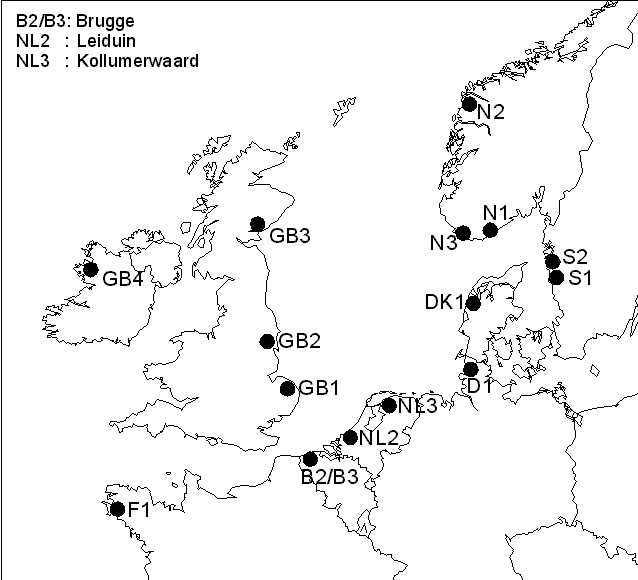
The stations and measurement program are listed in Tables 3.8 and 3.9 for precipitation and aerosols/gases respectively. Figure 3.2 shows the position of a selection of the monitoring stations.

The stations are located mostly along the rim of the North Sea, the waters to be protected by the Convention.

The compound selection is concentrated around nutrients (N-compounds) and heavy metals. Organo-halogens are also measured at some stations. The sampling frequency is generally daily (24-hour samples), and the whole year is covered.

Recently, persistent organic pollutants have been included in the programme, and work on inputs to the North Sea of PCBs, PAH, pesticides and dioxins have started.

Fig-3-2.gif (13204 bytes)


Figure 3.2: Location of 15 OSPAR/CAMP monitoring sites for aerosols and gases.


Table 3.8: Precipitation data submitted under OSPAR/CAMP 19941).


Preci-
pitation

Priority parameters

Grey list

Country

Station

Cd

Hg

a-HCH

g-HCH

NO3-N

NH4-N

As

Cr

Cu

Ni

Pb

Zn

Other

Belgium

Brugge

x

x


x

x


x


x

x


France

Porspoder

x

x


x

x

x

x

x

x

x

x


Germany

Westerland

x

x

x

x

x

x

x

x

x

x

x

x

x

o/halogens

Iceland

Irafoss
Reykjavik

x

x


x


x

x

x

x

x


Ireland

Turlough Hill
Valentia

x

x

x

x

x

x

x

x

x

x

x

x

x

o/halogens

Netherlands

De Zilk
Kollumer waard

x

x

x


x

x

x

x

x

x

x

x

x


Norway

Lista
Kårvatn
Ny Ålesund

x

x

x

x

x

x

x

x

x

x

x

x

x

o/halogens

Portugal

Viana do Castelo

x

x


x

x


x

x

x

x


Sweden

Gårdsjön
Rörvik
Svartedalen

x

x

x


x

x

x

x

x

x

x

x

o/halogens

United Kingdom

East Ruston
Driby
High Muffles
Banchory
Glen Dye
Isle of Wight
Chilton

x

x


x

x

x

x

x

x

x

x

o/halogens

1) The markings (x) represent the monitoring programme of each country. For countries with more than one monitoring station, all compounds are not necessarily measured at all sites.


Table 3.9: Aerosol and gas data submitted under OSPAR/CAMP 19941) .

Country

Stations

Priority parameters

Grey list

Cd

Hg

a-HCH

g-HCH

HNO3-N

NO3-N

HNO3-N + NO3-N

NO2-N

NO-N

NH3-N

NH4-N

NH3-N +
NH4-N

As

Cr

Cu

Ni

Pb

Zn

Other

Belgium

Houtem
Moerkerke

x

x

x

Germany

Westerland

x

x

x

x

x

x

V??

Netherlands

Kollumer waard

x

x

x

x

x

x

x

x

x

Norway

Lista
Kårvatn
Ny-Ålesund

x

x

x

x

x

x

x

x

x

x

x

x

x

Sweden

Rörvik

Organics

United Kingdom

East Ruston
High Muffles
Banchory
Isle of Wight

x

x

x

x

x

x

x

1) The markings (x) represent the monitoring programme of each country.

For countries with more than one monitoring station, all compounds are not necessarily measured at all sites.


HELCOM

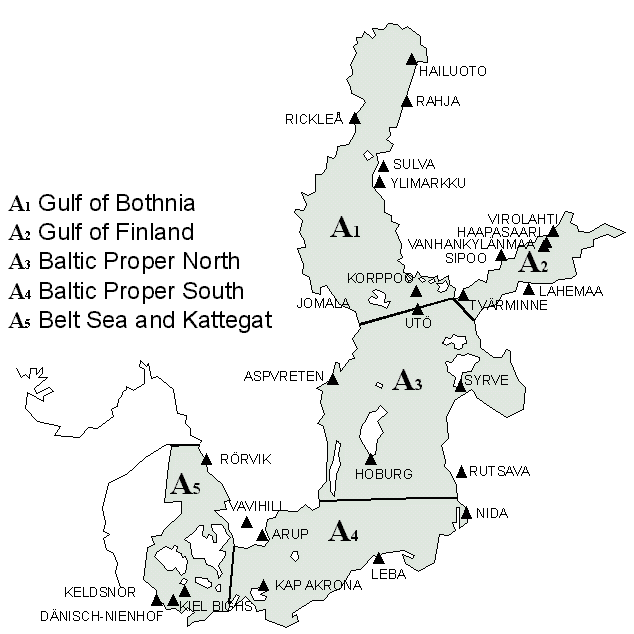
The monitoring network under the HELCOM Commission consists totally of 31 stations in 8 countries. The location of 26 of those stations is shown in Figure 3.3, located mainly along the rim of the Baltic Sea (HELCOM, 1991).

The recommended list of parameters for the monitoring of "airborne pollution load" is as follows:


"Routine Minimum
Requirements"

"Experimental"

N

precipitation

+


precipitation

+


gas

-

+


gas + particles

-

+


gas + particles

-

+

Pb

precipitation

+*)


particles

-

+


Cd

precipitation

+*)


particles

-

+

Cu, Zn

precipitation

+*)


particles

-

+

Cr, Ni, As and Hg precipitation

-

+

+ monitored on routine or experimental basis

- not monitored on routine basis

*) monitored on routine basis, from at least one station of each country


Regarding data quality, the countries are requested to "apply reliable analytical procedures", and to report all major ion concentrations in precipitation, to check the ion balance of the results.

The HELCOM data base covers the period from 1983-1984, and coverage is rather complete for a majority of the stations.

Fig-3-3.gif (18058 bytes)

Figure 3.3: Location of HELCOM stations.


MEDPOL

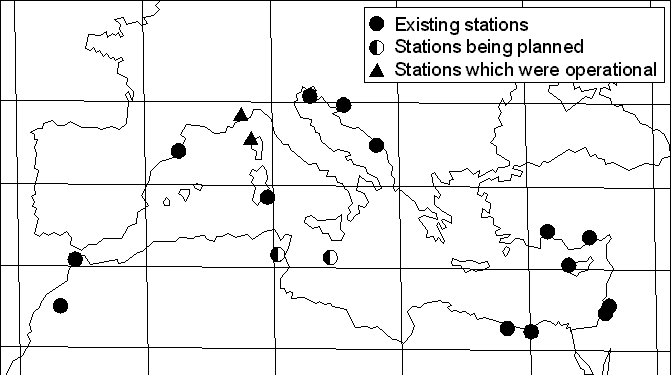
In the MEDPOL monitoring programme, a total of 13 stations in 10 countries are operated (1993). Figure 3.4 indicates the location of the stations along the coast of the Mediterranean Sea. The programme includes, as for OSPAR/CAMP and HELCOM, precipitation and aerosol, and gases at some stations.

The emphasis of the program is on heavy metals in aerosol and in precipitation, together with major ions in precipitation.

An overview of the data reported from the individual stations is given in Tables 3.10 and 3.11 for aerosol and precipitation respectively (WMO, 1994). Regarding data quality, recommendations are given in the programme on sampling and analytical procedures.

Fig-3-4.gif (10546 bytes)

Figure 3.4: Location of MEDPOL airborne pollution stations (Ref.: WMO, 1994).


Table 3.10: Summary characteristics of stations for deposition sampling and analysis in the MEDPOL programme.

COUNTRY

STATION

PARAMETERS

FREQUENCY

EQUIPMENT

ANALYTICAL

FRANCE (1) Background Major ions, pH, conductivity, soluble and insoluble elements Event by event during campaigns Wet only collector;
Home-made collector
Ion Chr., AAS, XRF
FRANCE (2) Background Al, Si, P, Na, Mn, Fe, Zn, Pb 15 days, for 3 years Bulk (preacidified) AAS, XRF
MOROCCO (1) (Beni Mellal) Background Pb, Cd, Zn, Cu, SO4, NO3 Event Wet-only AAS, UV-spectr.
MOROCCO (2) (Tangiers) Regional Pb, Cd, Zn, Cu, SO4, NO3 Event Wet-only AAS, UV-spectr.
ISRAEL (1) Coastal (regional) Ca, Cu, Mg, Cd, Pb, Zn, S, conductivity Daily Wet-only ICP
ISRAEL (2) Coastal (regional) Ca, Cu, Mg, Cd, Pb, Zn, S, conductivity Daily Wet-only ICP
ITALY Background pH, conduc., Ca, Mg, Na, K, Mn, NO3, SO4, Cl, alkal. Event Wet and dry Ion Chr., ICP, AAS
TURKEY (1) (Antalya) Background pH, SO4, NO3, Cl, NH4, metals Daily Wet and dry (ions)
Wet only (metals)
Ion Chr., AAS
TURKEY (2) (Erdemli) Background pH, cond., NO3, PO4, Ca, Na, Mg, Pb, Cd, Zn, Fe, Mn Event Wet and dry AAS, Colorimetry
CROATIA Background pH, Cond., HCO3, Cl, SO4, NO3, NH4, F, Na, K, Ca, Mg Daily, monthly Bulk AAS, UV-Spect., Titrimetric
TUNISIA
(currently not operational)
Background Cd, Pb, Zn, Cu, pH, Cl, SO4, NO3, NH4, Na, K, Ca, Mg Weekly    
YUGOSLAVIA Coastal (regional) Cd, Pb, Zn, Cu, pH, conduct., Cl, SO4, NO3, NH4, Na, K, Ca, Mg Daily Bulk AAS, Spectrophotometry
SLOVENIA Regional pH, conduct., Cl, SO4, NO3, NH4, Na, K, Ca, Mg Monthly Bulk Flame photometry, Spectrophotometry
CYPRUS Background Cd, Pb Event Wet only (KFA) AAS (graph. Furn.)

1) Stations from countries which responded to WMO questionnaire are included in the table.


Table 3.11: Summary characteristics of stations for aerosol sampling and analysis in the MEDPOL programme.

COUNTRY

STATION

PARAMETERS

FREQUENCY

EQUIPMENT

ANALYTICAL

FRANCE Background Na, Al, Si, P, S, Cl, K, Ti, Mn, Fe, Zn, Pb Daily continuous Low-Vol Sampler, Nucleopore filter XRF except for Na, Zn, Pb (AAS)
MOROCCO (1) (Beni Mellal) Background Pb, Cd, Zn, Cu, SO4 Monthly Hi-Vol Sampler,
Glass fibre filter
AAS, S (UV-spec)
MOROCCO (2) (Tangiers) Regional Pb, Cd, Zn, Cu, SO4 Monthly Hi-Vol Sampler,
Glass fibre filter
AAS, S (UV-spec)
ISRAEL (1) Coastal (regional) Ca, Cu, Mg, Cd, Pb, Zn, S Weekly Hi-Vol Sampler (Aquero), Glass fibre filter ICP
ISRAEL (2) Coastal (regional) Ca, Cu, Mg, Cd, Pb, Zn, S Weekly Hi-Vol Sampler (Aquero), Glass fibre filter ICP
ITALY Background Ca, Mg, K, Mn, Pb, Zn, (soluble)
Ca, Mg, Na, Si, Al, Fe, K, Cu, Pb, Zn, Cd (insoluble)
3 days Hi-Vol Sampler (Andersen),
Whatman 41 and Polyester filters
AAS (Graph. Fur.)
TURKEY (1) (Antalya) Background Al, Na, Cd, Zn, Sb, Pb, As, Se, V, Ni, SO4, NO3, Cl, NH4 Daily Hi-Vol Sampler (Andersen),
Impactor (Sierra)
Whatman 41 and nucleopore filters
AAS, INAA
TURKEY (2) (Erdemli) Background Al, Fe, Mn, Ca, Na, Mg, Cr, Ni, Zn, Cd, Pb, V, NO3, PO4 1-2 days Hi-Vol Sampler (Andersen)
Whatman 41 filter
AAS
CROATIA Background SO2, NO2, Cl   Glass, Polyethylene  
TUNISIA
(currently not operational)
Background Cd, Pb, Zn, Na, Al, SO4, 137Cs Weekly    
YUGOSLAVIA Coastal (regional) SPM Daily Hi-Vol sampler (Aquero)
Glass fibre filter
AAS, Spectrophotometry
SPAIN Background SPM, nutrients (nitrate, nitrite, ammonia, phosphates, silicates) Daily Hi-Vol sampler (Strohlein, HVS-150) Colorimetry
CYPRUS Background Cd, Pb, PAH Monthly Hi-Vol Sampler AAS, HPLS


Table 3.11: Cont.

Information required Approach Sampling duration 1) Sampling frequency 2) Supplementary data needed Parameters of interest Sampler type Filter type
Assessment of deposition on monthly basis Bulk deposition sampling 2 weeks Continuous Local met. data Cd, Pb, Cu, Zn, Al, Na Bottle and funnel sampler None
Assessment of long term trends in concentration over long periods Aerosol measurements 1 week (or for 3 days every week) Continuous Local met. data Cd, Pb, Cu, Zn, Al, Na Hi-Vol sampler at reduced flow rate GFF 3)
Assessment of wet vs. dry deposition Simultaneous wet-only and bulk sampling, or wet and dry sampling 4) 2 weeks Continuous Local met. data Cd, Pb, Cu, Zn, Al, Na Wet-only + bottle and funnel, or wet and dry sampler None
Assessment of wet and dry deposition and identification of the origin of the particulate matter Simultaneous wet-only + bulk (or wet and dry) deposition and aerosol sampling Aerosols
1-3 days (preferably 1-day)

Wet only
1-day or event

Bulk
1-week

Continuous Size separated concentrations

Back trajectories

Cd, Pb, Cu, Zn, Al, Na

id. (plus major ions)


id.

Wet-only + bottle and funnel (or wet and dry) sampler


Hi-Vol sampler

W-41 5)

1) Sampling duration, refers to the time interval in which samplers remain operational
2) Sampling frequency refers to the frequency of sampling in one year
3) Glass fibre filter
4) Dry and wet sampling refers to separate collection of wet-only and dry deposition samples
5) Whatman-41 cellulose filter


GAW

There are (1993) 157 GAW stations in operation in Europe (Region VI) (WMO, 1993). Two of them is defined as "global (baseline)" stations (Pallas-Sodankylä in Finland and Schauinsland/Wank/Zugspitze in Germany (for different compounds)), the rest are "regional".

  • 61 stations in 23 countries measure precipitation chemistry.

  • 100 stations in 29 countries measure the trace gases "in general", of which 81 stations measure O3, 43 stations measure NOx, 34 stations measure SO2, 20 stations measure CO2, 7 stations measure CH4, 3 stations measure N2O, and 4 stations measure CFCs.

  • 42 stations in 19 countries measure aerosols (mainly aerosol/particle mass), but some stations measure carbon black, physical characteristics such as size distribution, volatility, scattering, chemical composition, and turbidity.

  • 16 stations in 5 countries measure radiation.

  • 14 stations in 10 countries measure turbidity.

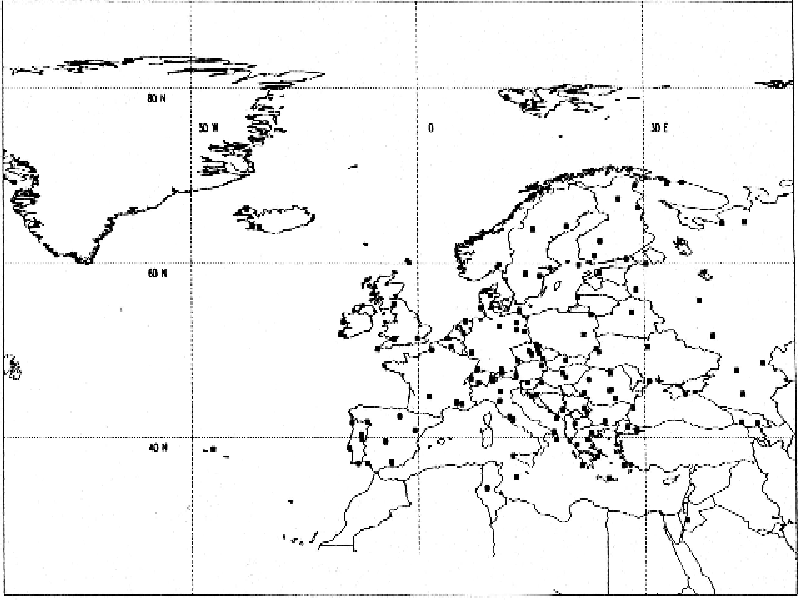
Figure 3.5 indicates the location of stations in Europe. The sampling programme and names of stations is given in Table 3.12.

Fig-3-5.gif (76844 bytes)

Figure 3.5: GAW stations in Region VI - Europe, as per 31 December 1993. (Ref.: WHO, 1993b.)


Table 3.12: GAW measurement programme in Region VI - Europe. (Ref.: WHO, 1993b.)

Country

Number of stations

Names of stations measuring

Estab

Active

Aerosols

Trace Gases G (i)

Precipitation
Chemistry

Radiation

Turbidity

1

2

46-49

12

51

3-9
19-29

43-45

83

15

57

72

In general

CO2

O3

CH4

N2O

CFCs

NO2

H2O

CH3CCl3

14CO2

SO2

Austria

3

2

Sonnblick

Wien

Sonnblick Sonnblick

Wien

Sonnblick Sonnblick

Belarus

1

1

Berezinskii
B.R.
Berezinskii

B.R.

Berezinskii
B.R.
Berezinskii
B.R.
Berezinskii
B.R.
Berezinskii
B.R.

Belgium

1

1

Uccle

Bulgaria

8

0

Croatia

3

2

Varazdin
Zavizan
Varazdin
Zavizan
Varazdin
Zavizan

Czech Republic

4

4

Kosetice
Svratouch

Hradec
Kralove
Kosetice
Praha
Svratouch
Kosetice Hradec
Kralove
Kosetice
Praha
Kosetice
Svratouch
Kosetice
Svratouch
Kosetice
Svratouch

Denmark

4

4

Søndre Strømfjord Søndre Strømfjord Edje
Godhavn
Tange

Finland

6

6

Ahtari
Oulanka
Utö
Virolahti

Ahtari
Oulanka
Pallas-
Sodankylä
Utö
Virolahti
Ahtari
Oulanka
Pallas-
Sodankylä
Utö
Virolahti
Ahtari
Pallas-
Sodankylä
Utö
Virolahti
Ahtari
Oulanka
Utö
Virolahti
Ahtari
Jokioinen
Oulanka

France

4

4

Haute Provence Haute Provence Abbeville
Carpentras
Gourdon
Carpentras

Georgia

2

2

Abastumani

Tbilisi

Abastumani

Tbilisi

Germany

13

13

Arkona

Arkona Brotjacklriegel Arkona Schauins-
land
Schauins-
land
Brotjacklriegel Brotjacklriegel Deuselbach Arkona Lindenberg

Brotjacklriegel

Brotjacklriegel Deuselbach Brotjacklriegel Deuselbach Deuselbach Hohenpeiss-
enberg
Hohenpeiss-
enberg
Potsdam

Deuselbach

Garmisch-
Partenkirchen
Neuglobsow Deuselbach Zugspitze Hohenpeiss-
enberg
Hohenpeiss-
enberg

Neuglobsow

Schauinsland Garmisch-
Partenkirchen
Neuglobsow Potsdam

Schauinsland

Hohenpeiss-
enberg
Waldhof Lindenberg Lindenberg Schauinsland Schauinsland

Waldhof

Wank Hohenpeiss-
enberg
Neuglobsow Neuglobsow Waldhof Wank

Westerland

Lindenberg Westerland Schauinsland Schauinsland Wank Zugspitze
Neuglobsow Zugspitze Lindenberg Waldhof Waldhof
Potsdam Neuglobsow Wank Wank
Schauinsland Potsdam Westerland Westerland
Waldhof Schauinsland Zugspitze
Wank Waldhof
Westerland Wank
Zugspitze Westerland
Zugspitze

Greece

9

7

Thessaloniki

Thessaloniki Thessaloniki Thessaloniki Methoni Attica Thessaloniki
Halkidiki


Table 3.12 (contd.)

Country

Number of stations

Names of stations measuring

Estab

Active

Aerosols

Trace Gases G (i)

Precipitation
Chemistry

Radiation

Turbidity

1

2

46-49

12

51

3-9
19-29

43-45

83

15

57

72

In general

CO2

O3

CH4

N2O

CFCs

NO2

H2O

CH3CCl3

14CO2

SO2

Greece

9

7

Heraklion

(contd.)

Komotini
Kos

Thessaloniki

Hungary

2

2

K-Puszta

Budapest-Lorinc
K-Puszta
K-Puszta Budapest-Lorinc
K-Puszta
K-Puszta K-Puszta K-Puszta K-Puszta

Iceland

3

2

Irafoss

Irafoss
Reykjavik
Reykjavik Irafoss Irafoss

Ireland

2

2

Mace Head
Valentia
Mace Head
Valentia
Mace Head Mace Head
Valentia
Mace Head Mace Head Mace Head Mace Head
Valentia
Valentia Mace Head
Valentia
Mace Head
Valentia
Valentia

Italy

10

8

Monte
Cimone

Brindisi
Cagliari/
Elmas
Monte
Cimone
Sestola
Vigna di Vale
Monte
Cimone
Brindisi
Cagliari/
Elmas
Sestola
Vigna di Vale
Monte
Cimone
Monte
Cimone
Trapari/Birgi
Verona
Viterbo
Monte
Cimone
Verona
Viterbo

Jordan

1

1

Shoubak Shoubak

Latvia

2

2

Rutsava

Riga
Rutsava
Riga
Rutsava
Rutsava

Macedonia
F.Y.Rep.of

1

1

Lazaropole Lazaropole Lazaropole

Netherlands

1

1

De Bilt De Bilt

Norway

4

4

Ny-Ålesund/
Spitsbergen

Longyearbyen
Ny-Ålesund
Oslo
Tromsø
Longyearbyen
Ny-Ålesund
Oslo
Tromsø
Ny-Ålesund Ny-Ålesund Ny-Ålesund Ny-Ålesund Ny-Ålesund

Poland

4

4

Jarczew
Leba
Sniezka
Suwalki

Jarczew
Sniezka
Suwalki
Suwalki Jarczew
Sniezka
Jarcew
Sniezka
Suwalki
Jarcew
Sniezka
Suwalki

Portugal

7

7

Angra Do
Heroismo

Braganca

Castello

Branco

Faro

Viana Do

Castelo

Angra Do

Heroismo

Funchal

Lisboa

Penhas

Duradas

Angra Do

Heroismo

Funchal

Lisboa

Penhas

Duradas

Angra Do

Heroismo

Funchal

Lisboa

Penhas

Duradas

Angra Do

Heroismo

Braganca

Castello

Branco

Faro

Viana Do

Castelo


Table 3.12 (contd.)

Country Number of stations

Names of stations measuring

Estab

Active

Aerosols

Trace Gases G (i)

Precipitation
Chemistry

Radiation

Turbidity

1

2

46-49

12

51

3-9
19-29

43-45

83

15

57

72

In general

CO2

O3

CH4

N2O

CFCs

NO2

H2O

CH3CCl3

14CO2

SO2

Romania

6

6

Bucharest Bucharest Bucharest Bucharest
Fundsta Fundsta Fundsta Fundsta
Predeal Predeal Predeal Predeal
Rareu Rareu Rareu Rareu

Semenic
Stina de Vale
Semenic
Stina de Vale
Semenic
Stina de Vale
Semenic

Russian Federation

23

23

Pinega

Yaniskoski

Arkhangelsk

Barentsburg

Bering Is

Kheysa Is

Moscow

Murmansk

Pechora

Kamchatskii

Pinega

St. Petersburg

Bering Is.

Teriberka

Arkhangelsk

Barentsburg

Kheysa Is

Moscow

Murmansk

Pechora

Kamchatskii

Pinega

St. Petersburg

Arkhangelsk

Barentsburg

Yaniskoski

Yaniskoski Pinega

Pushkinskiye

Gory

Pyatigorsk

Syktyvkar

Voronezh

Yaniskoski

Yasnaya

Polyana

Pyatigorsk

Syktyvkar

Samara Samara
Teriberka

Tsimlyarsk

Volgograd

Voronezh

Yaniskoski

Teriberka

Tsimlyarsk

Volgograd

Voronezh

Slovakia

4

2

Chopok

Chopok

Ganouce

Ganouce Chopok Chopok

Slovenia

1

0

Spain

5

3

La Cartuja

Logroño

Roquetas

La Cartuja

Logroño

Roquetas

La Cartuja

Logroño

Roquetas

La Cartuja

Logroño

Roquetas

La Cartuja

Logroño

Roquetas

Sweden

4

3

Sjöangen

Norrköping

Vindeln

Norrköping

Vindeln

Switzerland

4

4

Jungfraujoch

Payerne

Arosa

Jungfraujoch

Payerne

Arosa

Jungfraujoch

Payerne

Payerne

Jungfraujoch

Payerne

Payerne

Davos

Ukraine

6

5

Rava-Russkaya

Feodosiya

Kiev

Lvov

Odessa

Feodosiya

Kiev

Lvov

Odessa

Rava-Russkaya

UK

6

5

Eskdalemuir

Lerwick

Camborne

Eskdalemuir

Lerwick

Sibton

Sibton

Camborne

Lerwick

Sibton

Lerwick

Camborne

Eskdalemuir

Camborne

Eskdalemuir

Eskdalemuir

Lerwick

Ocean Station "L"

Yugoslavia

3

3

Kamenicki-Vis

Zabljak

Kamenicki-Vis

Zabljak

Herceg-novi

Kamenicki-Vis

Zabljak

Total No.

Stations

157

134

42

100

20

81

7

3

4

43

1

34

61

16

14

Countries

32

30

19

29

9

24

6

3

4

16

1

15

23

5

10


TOR

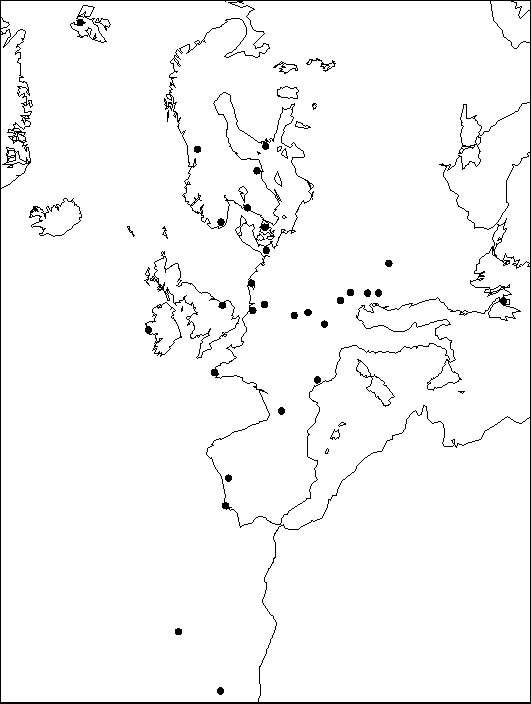
In 1994, there were a total of 29 stations in the network doing ground-based measurements, as shown in Table 3.13. In addition, there were 5 sounding stations. Many of the stations are part of other programmes, and were already in operation before TOR started. The measurement program is given in Table 3.14, as it was in 1992. The location of the stations is indicated on the map in Figure 3.6.

The monitoring programme includes the compounds O3, NO, NO2, NOy, CH4, CO, NMHC, JNO2 and meteorological data.

The last operating year of the TOR network was 1994. However, most of the stations, if not all, are still in operation under other programmes.


Table 3.13: TOR stations, 1994.

Northern Europe

Central Europe

Ny-Ålesund

Donon

Åreskutan

Schauinsland

Utö island

Jungfraujoch

Aspvreten

Zugspitze

Birkenes

Wank

Rörvik

Sonnblick

Lille Valby

Krvavec


Puntijarka

Western Europe

Zagreb-RBI

Mace Head

K-Puszta

Porspoder


Brennilis

Southern Europe

Weybourne

Pic du Midi

Kollumerwaard

Penh. Douradas


Lisbon-INMG


Angra do Heroismo


Funchal


Izana


Athens

Sounding stations


Hungriger Wolf


Jülich


Uccle


Garmisch


Haute Provence


Fig-3-6.gif (9440 bytes)

Figure 3.6: Locations of TOR stations, 1994. (Ref.: Cvitaš and Kley, 1994).


Table 3.14: TOR stations, measurement program, 1992. (Ref.: Kley et al., 1993.)


TOR station # Name of site Principal Investigator(s) O3 NO NO2 NOY CH4 CO NMHC C2-C5 NMHC

> C5

JNO2 Met-data
1 Ny Ålesund Ø. Hov CO CO CO CO W3 CO W3 W3 CO CO
2 Birkenes Ø. Hov CO - W7 - W3 - W3 W3 - CO
3 Utö island T. Laurila d24 d24 d24 - W3 - W3 - d24 d24
4 Åreskutan P. Oyola CO - - - - - - - - -
5 Rörvik A. Lindskog CO CO CO - - - d6 d6 - CO
7 Weybourne S.A. Penkett CO CO CO CO - CO OC OC CO CO
8 Mace Head P. Simmonds d24 - - - d12 d24 - - - -
9 Kollumerwaard J. Beck CO CO CO - CO CO CO - CO CO
10 Porspoder G. Toupance CO CO CO - - - d24 d24 CO CO
11 Schauinsland A. Volz-Thomas
D. Kley
CO CO CO CO - CO d8 d8 CO CO
12b Wank H. Scheel
W. Seiler
CO CO CO CO - - - - - CO
12c Zugspitze H. Scheel
W. Seiler
CO CO CO - d72 d72 - - CO CO
13 Sonnblick H. Puxbaum
K. Radunsky
CO - - - - - - - - CO
14 Pic du Midi A. Marenco CO see notes see notes see notes - d48 - - - -
15 K-Puszta L. Haszpra CO - W7 - - - W1 W1 - CO
16 RBI L. Klasinc CO CO CO - - - - - CO CO
17 Izana R. Schmitt CO CO CO CO CO see notes see notes see notes CO CO
18 Jungfraujoch L. Delbouille

see notes

19 Aspvreten P. Oyola CO CO CO CO - CO OC - CO CO
20 Donon G. Toupance CO CO CO - - - - - - CO
21 Lille Valby T. Nielsen d48 d48 d24 d48 - - OC - - CO
25 UK-network M.L. Williams
J.S. Bower
                   
27 Puntijarki L. Klasinc CO - - - - - - - - CO
? Kravec B. Gomiscek CO - - - - - - - - CO


AMAP

The activities in AMAP covers several environmental media (air, water, marine and terrestrial ecosystems, and effects on these). There are 5 monitoring stations for air associated with AMAP: Ny Ålesund at Spitzbergen, Nord on Greenland, Pt. Barrow in Alaska, Alert in Canada, and Wrangel Island in Russia. Of these, only Ny Ålesund is located within the European Arctic.

At Ny Ålesund, the measurement program covers acidity, heavy metals and persistent organic pollutants (POP) such as pesticides (a and g HCH, chlordanes, DDT) PCBs, PAH.


GEMS/AIR

Programme

Table 3.15 shows the cities in Europe which have been involved in the GEMS/AIR programme since about 1970. As the table shows, only 9 cities have reported data for 1993 and/or 1994 to the central GEMS data base.

It is safe to assume that the monitoring sites in the cities of Table 3.15 which report to GEMS, are in operation under other, national monitoring networks, and are thus included in the network descriptions of Appendix B and in Tables 3.2 and 3.3.

The GEMS/AIR programme is so far restricted to monitoring SO2 and SPM.

Data quality assurance

Data validation and the reliability and comparability of the monitoring data is considered a crucial element of the programme. This will be achieved by means of collaborative reviews through UNEP/WHO Regional Support Centres which will be performed in South America, South East Asia, Northern and Sub Saharan Africa and Eastern Europe.

Data storage, representation and access

Data are presently put into a database from hard copy and via the GEMSDATA PC programme. The database is the Aerometric Information Retrieval System AIRS of USEPA in which the air quality data are stored under the auspices of UNEP/WHO. As the use of the GEMSDATA diskette requires some manipulation to transfer the data into the AIRS format; in the future a PC programme GEMSAIRS will be used in order to transfer the data from an ASCII format directly to the AIRS interface. AIRS then will provide a data presentation on the basis of a geographical information system. It is planned to have access to the data via the Internet.


Table 3.15: GEMS/AIR network stations in Europe.

Country

City

Last year of reporting

Austria

Retz

1971

Belgium

Brussels


Croatia

Zagreb

1993

Czechoslovakia

Praha

1978

Denmark

Copenhagen

1986

Finland

Helsinki

1993

France

Toulouse
Gourdon

1984
1984

Germany

Frankfurt

1994

Greece

Athens

1994

Ireland

Dublin

1990

Italy

Milan

1983

Luxembourg

Luxembourg

1988

Netherlands

Amsterdam

1986

Poland


1993

Portugal


1993

Romania


1994

Spain


1994

Sweden

Stockholm

1980

Switzerland

Zurich

1978

United Kingdom

London
Glasgow

1994

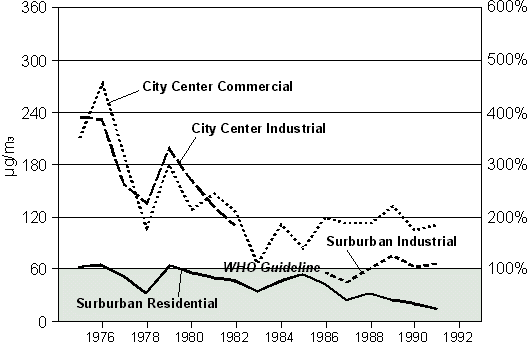
Data from the programme is reported occasionally in City Air Quality Trends reports (UNEP/WHO, 1992, 1993, 1995). As an example, the data for Madrid, as reported by UNEP/GEMS (1993) is reproduced in Figures 3.7 and 3.8.

At present, efforts are made by the GEMS/AIR secretariat in Geneva to revitalise the programme.
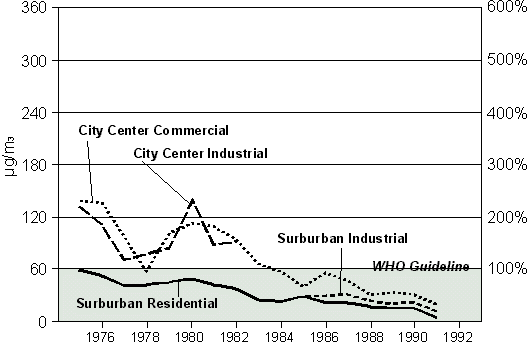
Fig-3-7.gif (7791 bytes)

Figure 3.7: Annual mean SO2, Madrid.


Fig-3-8.gif (8109 bytes)

Figure 3.8: Annual mean SPM (smoke), Madrid.

lijn.gif (900 bytes)

up.gif (859 bytes)
left.gif (869 bytes) right.gif (869 bytes)

Permalinks

Document Actions