Extraction Signal 1: Heavy metal emissions to water from the extractive sector
Monitoring how mining and other extractive industries pollute water bodies is complex. Part of the problem is that pollution can come from many sources, such as intentional discharges and the leaching and additional run-off that occurs at such sites. This can affect water and soil quality.
The EU industrial reporting database contains data on pollution from the largest industrial facilities in Europe, comprising over 91 substances (see Figure 1). It provides data for ‘underground mining and related operations’ and ‘opencast mining and quarrying’ and covers pollution from EU Member States plus Iceland, Liechtenstein, Norway, Serbia and Switzerland from 2007 to 2020.
This database shows that mining activities continue to release significant volumes of heavy metals such as copper, zinc and lead each year. In fact, most copper and zinc come from underground mining and related operations. It should be noted that more diffuse forms of water pollution, such as those related to leaching from mineral deposits or post-closure pollution, may be underestimated.
Note: These data should be interpreted with caution since they can vary significantly from year to year due to significant changes in reported emissions from individual plants (which can skew the data). In some cases, these reported emissions are based on extrapolations of a small number of measurements and may not fully represent actual annualised emissions.
Source: Data reported to the European Industrial Emissions Portal (EEA, 2022). Activities covered: 3a and 3b in Annex I of the European Pollutant Release and Transfer Register (E-PRTR) Regulation (‘underground mining and related operations’ and ‘opencast mining and quarrying (where the surface of the area effectively under extractive operation equals 25 hectares).
Click here for different chart formats and data
Extraction Signal 2: Raw material imports and country performance
Robust estimates of pollution linked to materials extracted elsewhere and imported into the EU are challenging to gather. Individual studies have been carried out on the environmental impact of extracting materials in specific locations. However, comprehensive information is needed to better understand the differences between materials extracted in Europe and those extracted outside its borders.
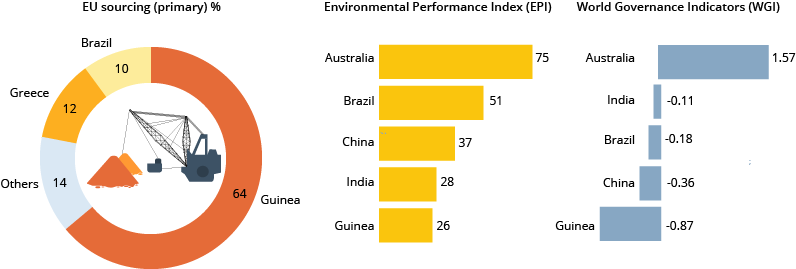
The JRC raw materials dashboard provides data on EU extraction and trade for 81 materials (see the example for bauxite in Figure 1). The dashboard specifies the country from which virgin materials have been imported. It also provides information on each country’s environmental and governance performance (using certain proxy indicators), which helps clarify if these environmental practices are sound. The data also outline whether importing more materials extracted abroad increases pollution. The data are based on the 2020 list of critical raw materials, providing an average for the years 2012-2016.

Note: EPI, Environmental Performance Index; WGI, World Governance Indicators.
Source: Data extracted from the raw materials dashboard of the Raw Materials Information System.
Extraction Signal 3: Hotspot analysis tool for sustainable production and consumption
Based on the International Resource Panel’s global material flows database, the hotspot analysis tool for sustainable production and consumption provides modelled data about pollution impacts on health by economic sector. It also covers oil and gas and ore mining and their corresponding subsectors. The tool enables comparison of the ways in which pollution from domestic production impacts health (Figure 1); in parallel, it analyses the relationship between consumption patterns and pollution impacts. Data are provided for single countries on total impact as well as impact per economic output, per value added and per worker in the sector. The data cover the years 1990-2018.
Figure 1 shows that, over the last few years, pollution from the domestic hard coal production subsector continuously decreased and then stabilised. In contrast, the pollution footprint from raw materials taken outside the EU did not meaningfully decrease over the same period (this is not shown in the graph below but is available in the source tool).
Note: DALY, disability-adjusted life-year.
Source: SCP (2022), Module 2, ‘Hotspots identification’. The information can be found under the tab ‘Sectoral performance’, sub-tab ‘Trends by sector’.
Click here for different chart formats and data
Extraction Signal 4: Statistics on oil spills
Incidents in the extractive sector can significantly drive pollution and impact the environment. Data from ITOPF (2022) show a significant decrease in the number of oil spills over the last few years. However, these data specifically refer to tanker spills; oil spills from other sources are still a significant problem. For instance, the UN-Spider Knowledge Portal states that the number and severity of anthropogenic oil spills (covering any form of fossil fuel released into the ocean) have surged since the start of offshore oil drilling and fossil fuel transport via ships and pipelines. This is despite the continuous implementation of more stringent safety measures.
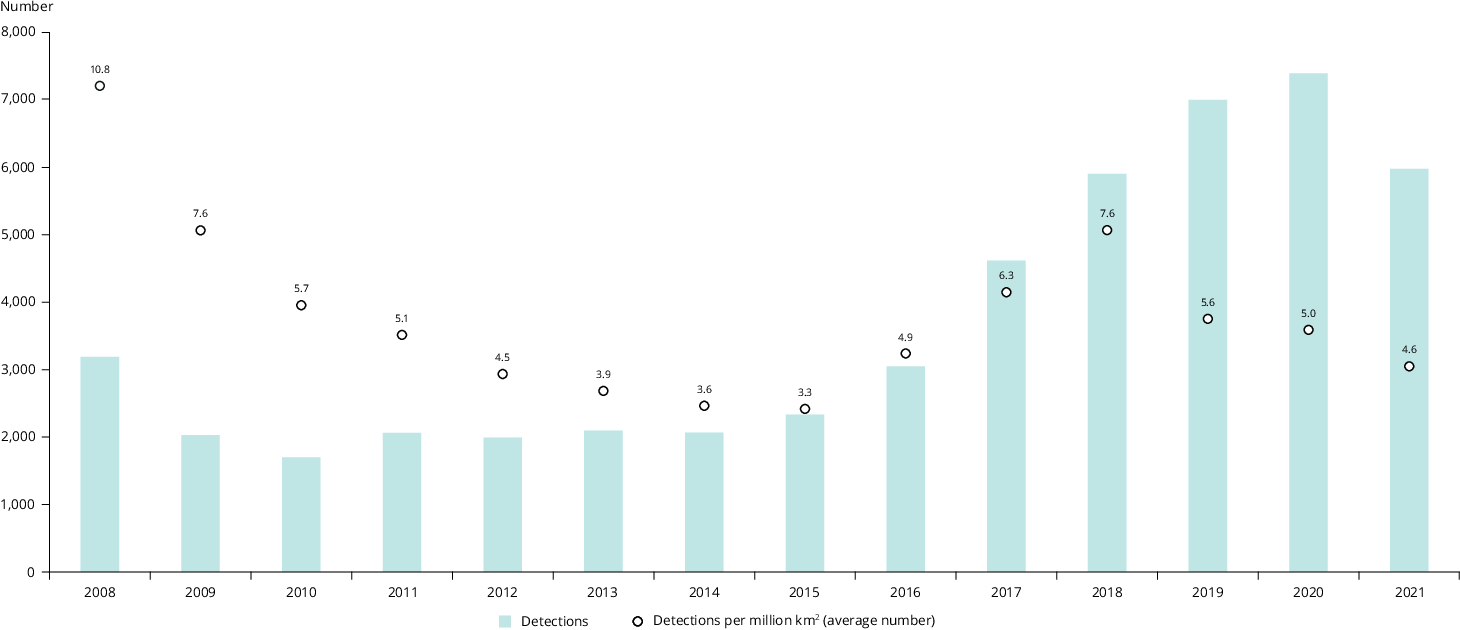
Additionally, the European Maritime Safety Agency (EMSA) uses satellite imagery to keep track of the number of possible oil spills per million km2 (see Figure 1). It is important to stress that these are possible oil spills; for the most part, they have not been validated with data on the ground. In 2016, new technology (namely the Sentinel-1 satellite constellation) allowed EMSA to detect smaller spills. This increased the number of spills detected up until 2018. After this point (with monitoring techniques remaining the same) a downwards trend in oil spills became visible.

Source: Data based on EMSA CleanSeaNet data (EMSA, 2022). Raw data processed by EMSA and provided to EEA.
Click here to view the figure enlarged
Click here for different chart formats and data
Cover image source: © Mateo Puđa, Well with Nature /EEA


Document Actions
Share with others