Key messages
- The activities involved in extracting and processing resources to satisfy modern consumption needs are highly polluting.
- Europe’s consumption patterns are unsustainable. Europe is exceeding various planetary boundaries and its particulate matter emissions, freshwater eutrophication and chemical releases are having harmful impacts.
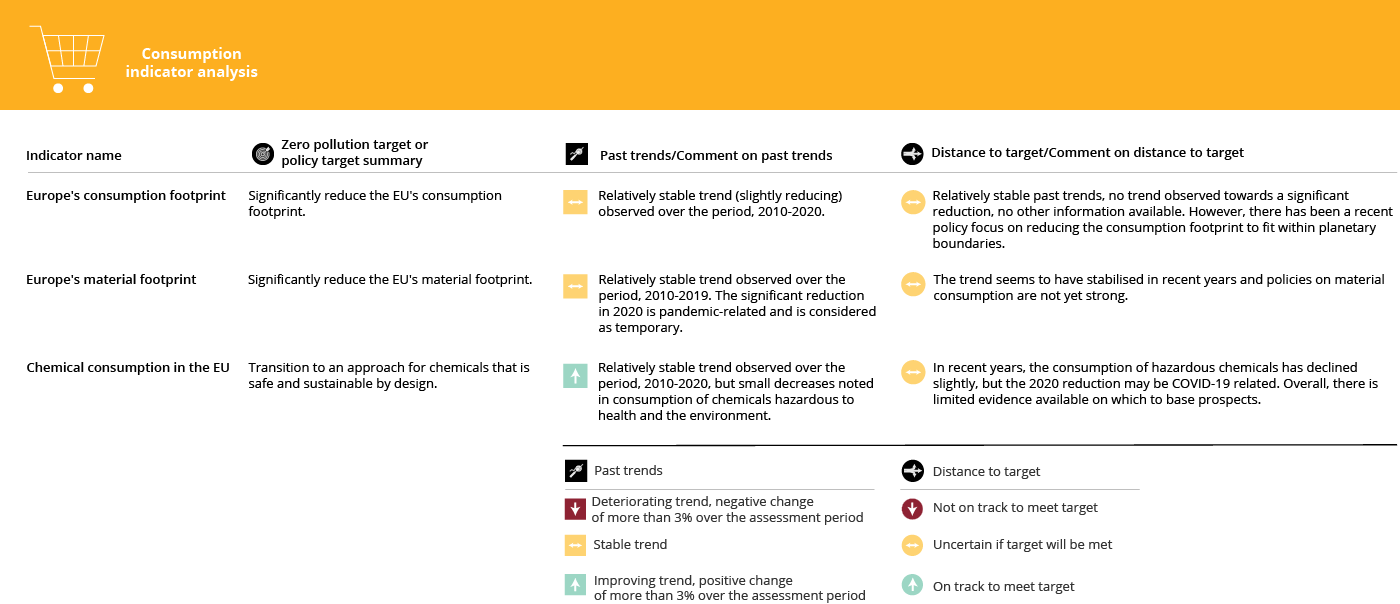
- Key indicators, such as the consumption footprint, material footprint and chemical consumption, show no signs of significantly reducing.
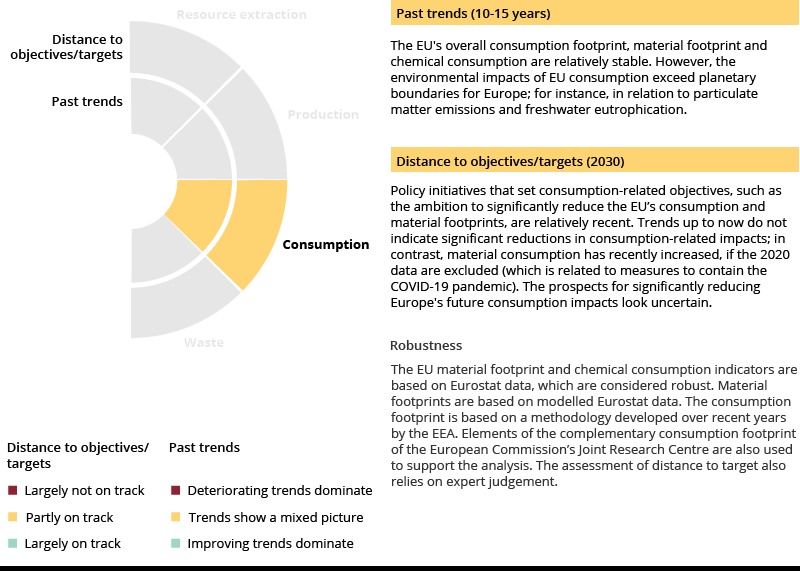
Guidance for interpreting the summary
The figure above summarises the overall findings on production. Two dimensions are considered:
- whether the recent trend in pollution is positive, negative or uncertain
- the current 'distance to target', based on an assessment of the current trends or status, and whether or not the EU is on track to achieve the defined zero pollution targets for 2030 and/or other relevant policy targets.
The assessment is based on a combination of (1) available indicators and data, and (2) expert judgement.
Introduction
Europe’s production and consumption systems are closely integrated. The demand for products and services is not only shaped by consumers but also dictated by the available production systems. Consumption patterns significantly affect the amounts, types and characteristics of the products and services produced or offered — as well as how they are managed when they become or generate waste. They are therefore directly linked to production and waste management processes, which are primary sources of pollution within the EU and abroad.
Both the zero pollution action plan and the circular economy action plan contain objectives to reduce Europe’s consumption, and the latter aims to double Europe’s circular material use rate in the coming decade. This section examines consumption patterns that can lead to pollution — from production processes to pollution-induced environmental impacts.
Consumption footprint and material footprint
The consumption footprint indicator maps the aggregated impacts of EU citizens’ consumption. It integrates the environmental and climate impacts caused by different economic sectors that are influenced by demand for goods and services.
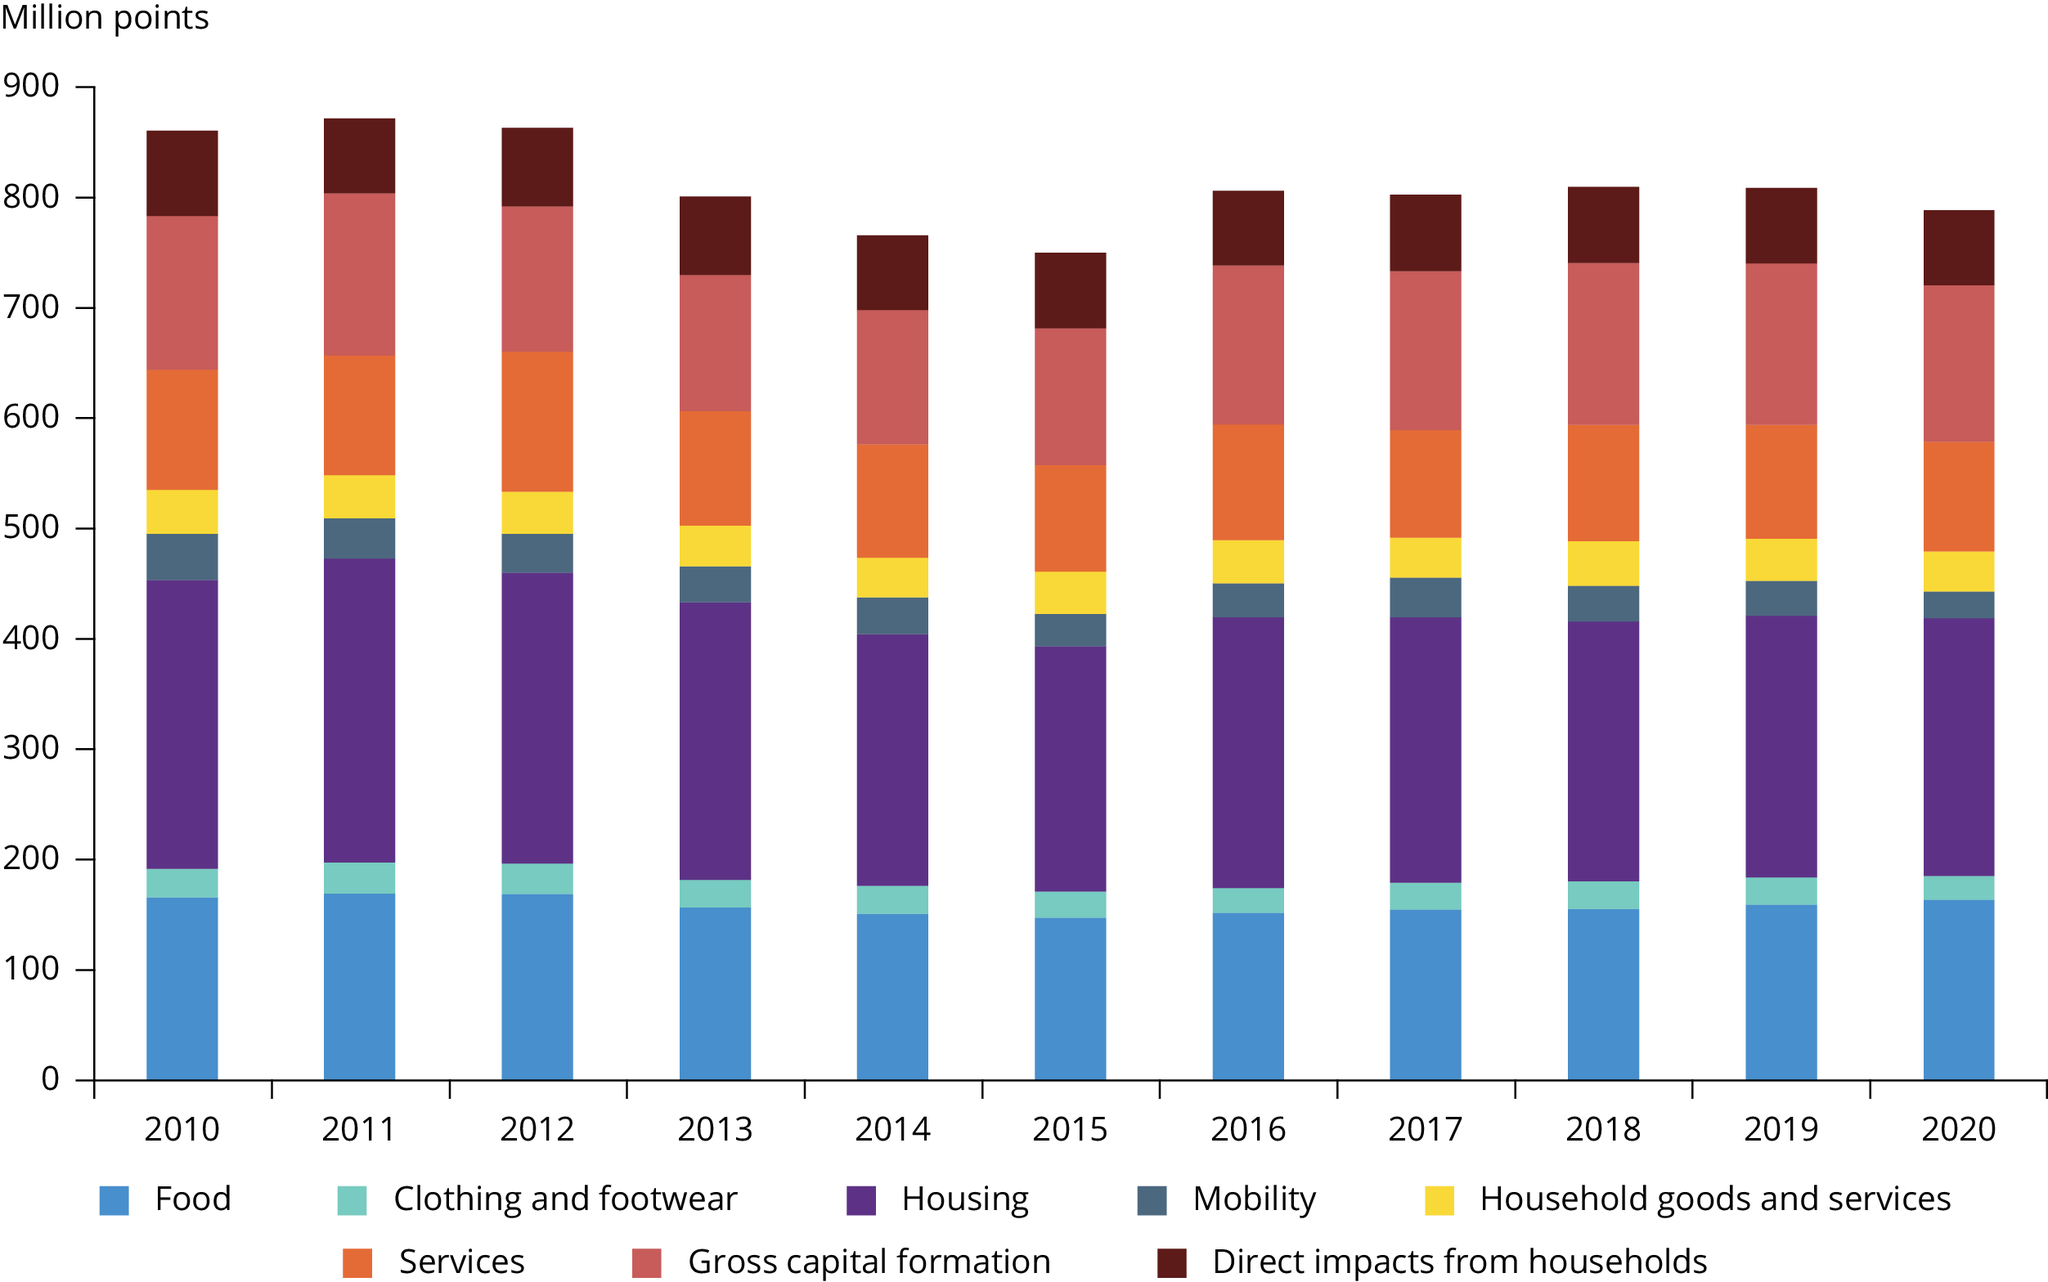
The EU’s consumption footprint, illustrated in Figure 15, showed a broadly stable trend over the period 2010-2020. However, the impacts of this footprint are not sustainable: they already significantly exceed Europe’s share of various planetary boundaries (EEA, 2020) (see the zero pollution ‘Signal’ on planetary boundaries).
Housing and food are the most significant consumption domains, accounting for more than half of the impacts caused by EU consumption, both within and outside the EU. Transportation is another area contributing significantly to consumption impacts across the EU (Sala et al., 2019). Shifting to less material-intensive consumption patterns will help Europe to reduce its consumption footprint.
Notes: The description of the methodology for this indicator can be found here.
Source: EEA (2022a).
Click here for different chart formats and data
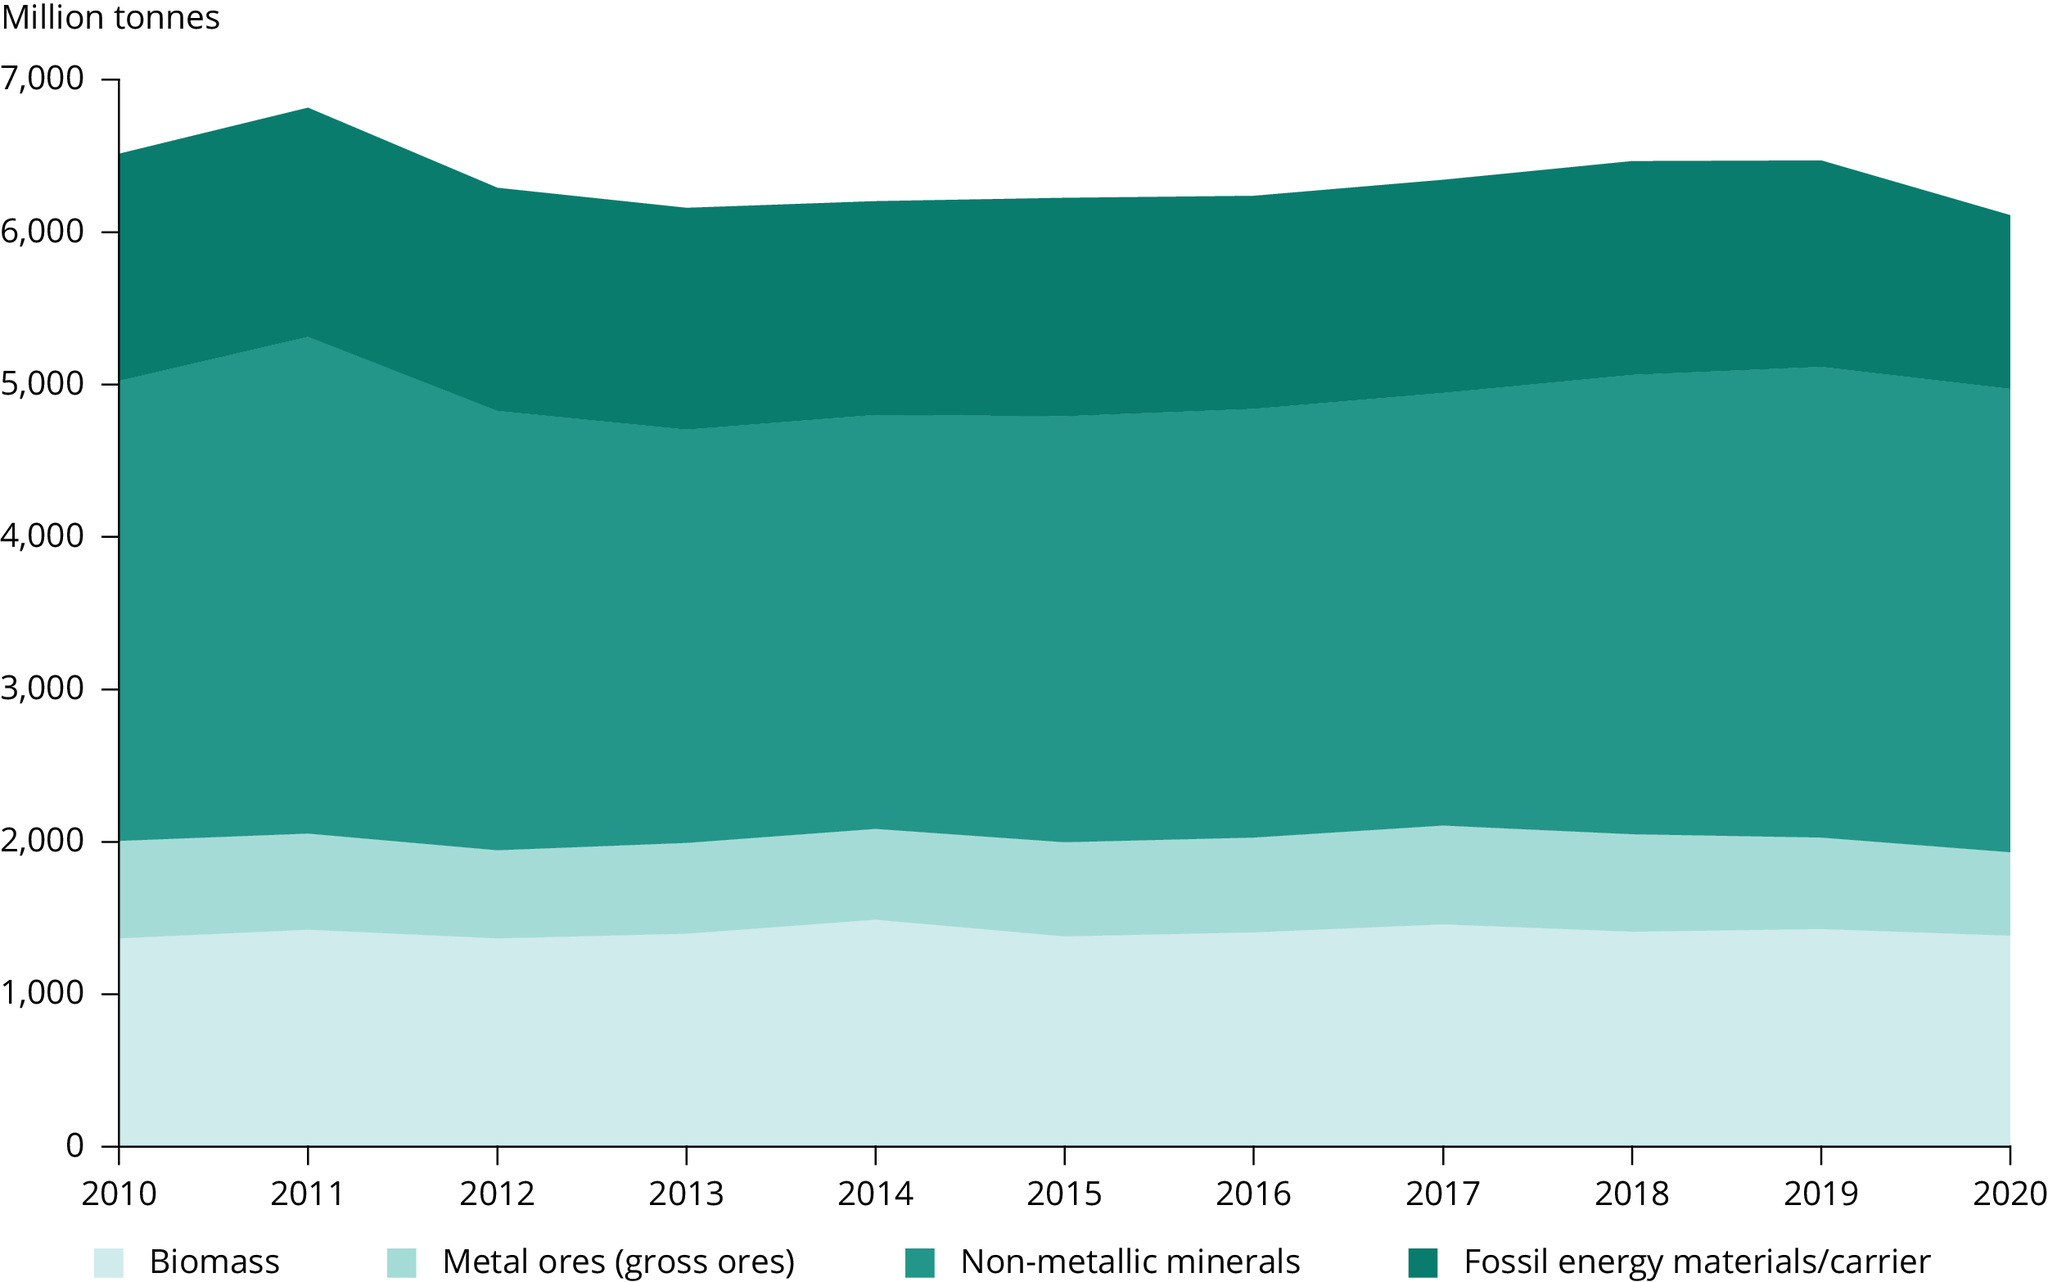
The material footprint in Figure 16 indicates the amount of resources needed to produce the goods and services consumed in the EU, regardless of where in the world these resources are extracted from and processed. Globally, extraction and resource processing is a very polluting economic activity, leading to over 90% of biodiversity loss (IRP, 2019). Other significant, resource-related impacts include eutrophication and toxicity from fertiliser application (IRP, 2019).
Overall, the EU’s material footprint decreased between 2010 and 2020 by 6.1%. However, the reduction until 2019 was insignificant (0.6%) and the (significant) decrease in 2020 is related to the economic downturn in Europe due to COVID-19 measures. Therefore, it is considered a temporary phenomenon. If pollution related to resource use to satisfy EU demand is to be tackled, both the intensity and the type of consumption need to be addressed.
Source: EEA (2022b); adapted from Eurostat.
Click here for different chart formats and data
Chemical consumption offers a proxy for assessing the pollution potential of European consumption. Overall, chemical consumption — of chemicals hazardous to both human health and the environment — is now nearly 9% lower than in 2004 (also affected by a sudden drop in 2009 due to the global financial crisis of that time). However, since 2016, consumption has been rising (Figure 17), except for a decrease noted in 2020 which is likely to be related to COVID-19 impacts.
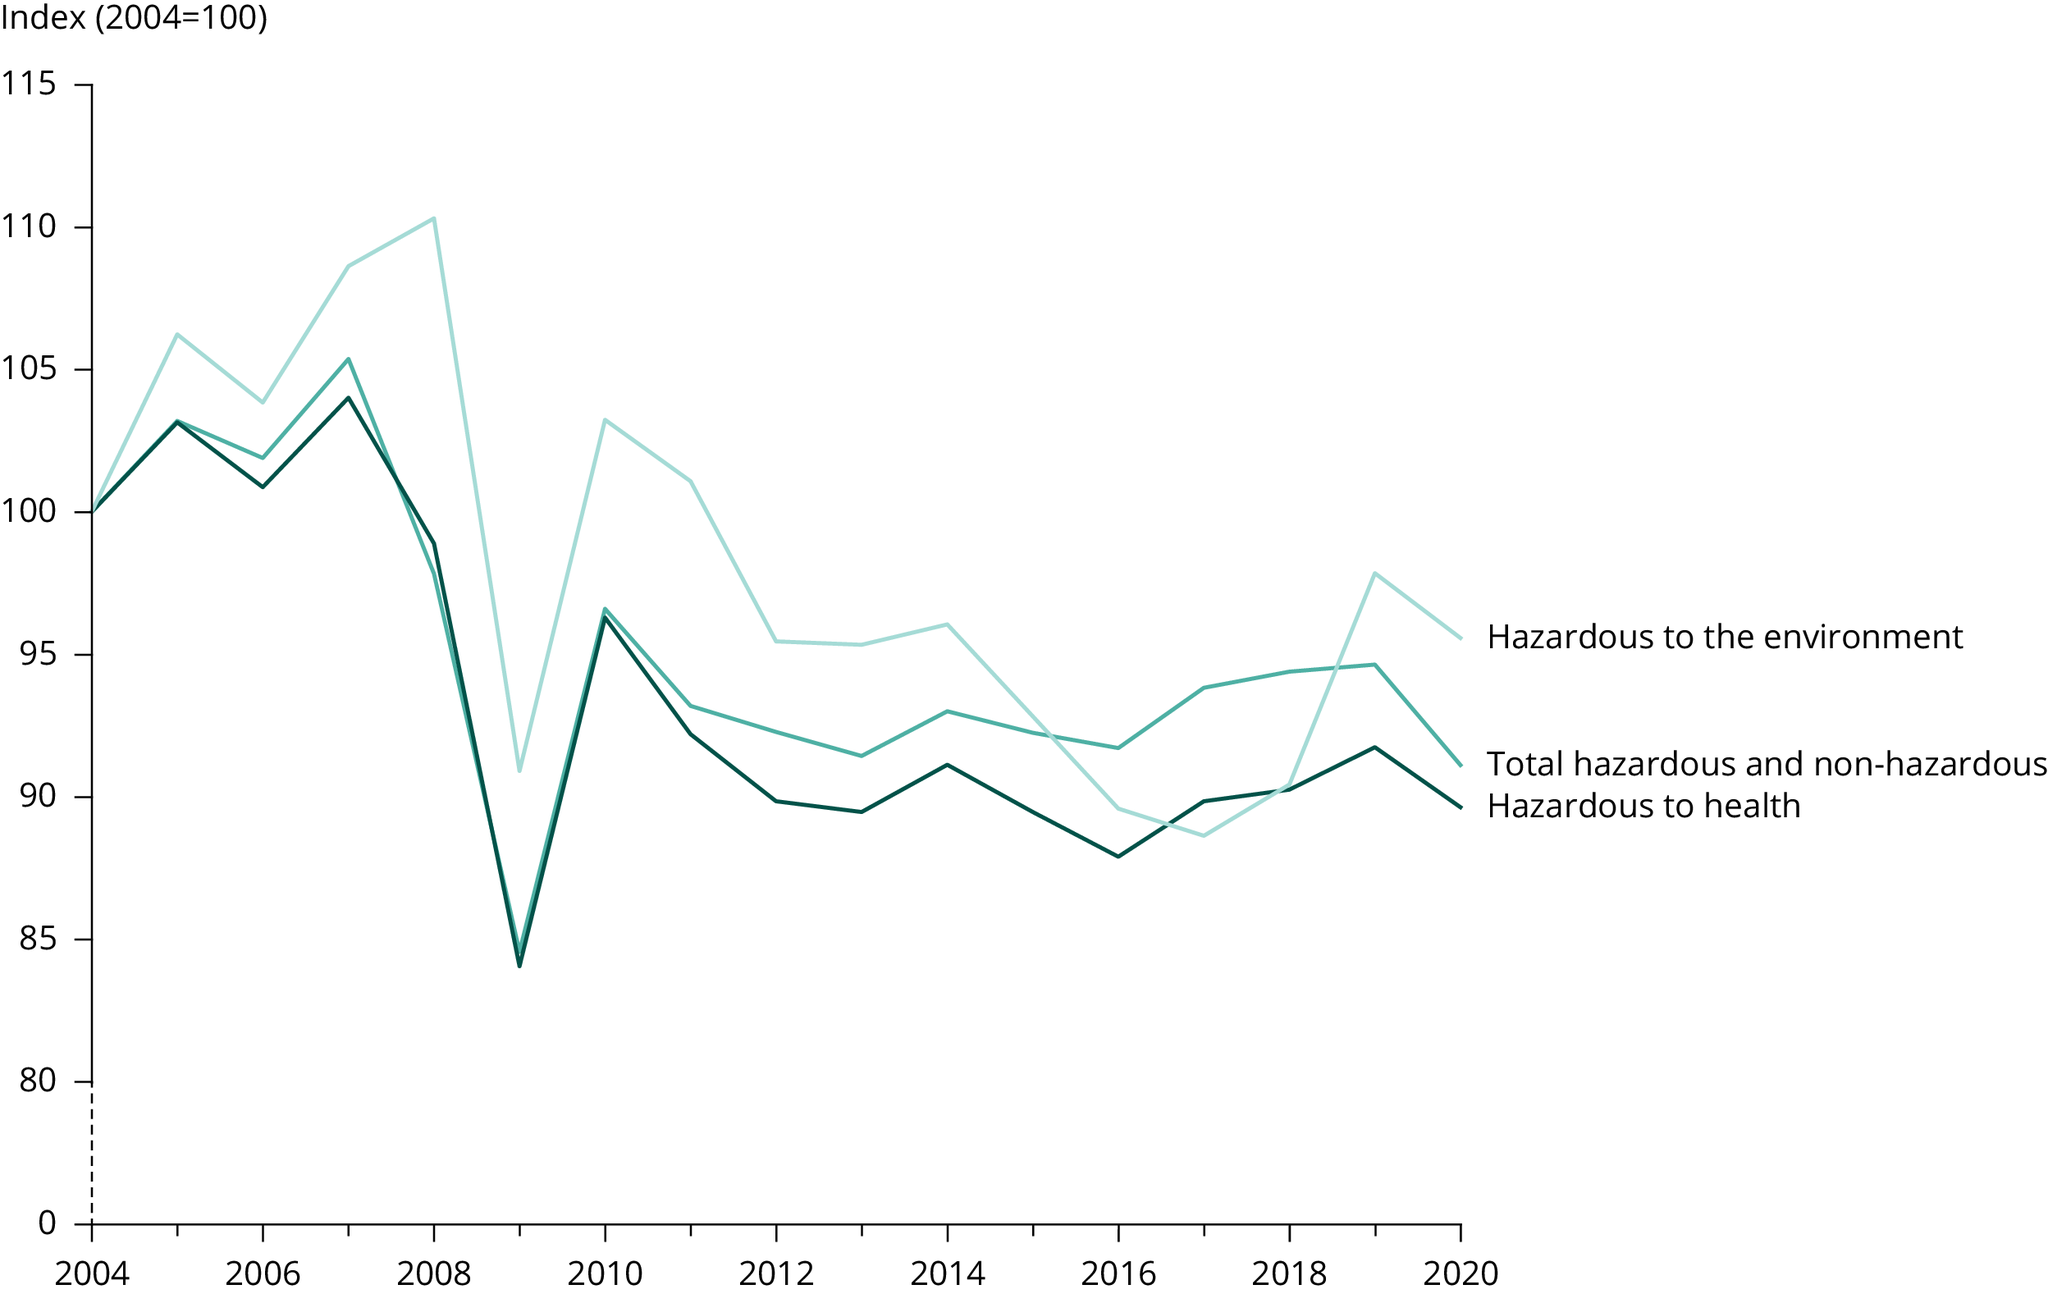
Note: This indicator is based on a selected number of hazardous and non-hazardous chemicals and often aggregates multiple substances into one category. Therefore, trends should be interpreted with caution.
Source: Eurostat, 2021.
Click here for different chart formats and data
Note: Link to indicators: Europe’s consumption footprint, Europe’s material footprint, Chemical consumption in the EU.
Overview of indicator analysis methodology
This indicator analysis is in line with the approach taken by the EEA for its seventh environment action programme monitoring.
Past trends are based on assessment of the trend over the last 10 years (or since the relevant zero pollution baseline year where appropriate) with green, yellow or red being applied based on the criteria as outlined in the figure legend. Expert judgement is also applied, for example in cases where indicators are more qualitative and/or uncertain.
The distance to target is based on an assessment of the recent trend, current status and expert judgement.
Further detailed analysis of the future outlook for meeting certain zero pollution targets is included in the zero pollution outlook 2022, completed by the European Commission Joint Research Centre (JRC, 2022).
References
EEA, 2020, Is Europe living within the limits of our planet?, EEA Report No 1/2020, European Environment Agency (https://www.eea.europa.eu/publications/is-europe-living-within-the-planets-limits) accessed 10 October 2022.
EEA, 2022a, ‘Europe’s consumption footprint’, European Environment Agency (https://www.eea.europa.eu/ims/europe2019s-consumption-footprint) accessed 10 October 2022.
EEA, 2022b, ‘Europe’s material footprint’, European Environment Agency (https://www.eea.europa.eu/ims/europe2019s-material-footprint) accessed 10 October 2022.
Eurostat, 2021, ‘Chemicals production and consumption statistics’, Eurostat Statistics Explained (https://ec.europa.eu/eurostat/statistics-explained/index.php?title=Chemicals_production_and_consumption_statistics#Total_consumption_of_chemicals) accessed 10 October 2022.
IRP, 2019, Global resources outlook 2019:natural resources for the future we want, International Resource Panel, Paris (https://www.resourcepanel.org/reports/global-resources-outlook) accessed 10 October 2022.
JRC, 2022, Zero pollution outlook 2022, JRC129655, Publications Office of the European Union, Luxembourg, Joint Research Centre (https://joint-research-centre.ec.europa.eu/zero-pollution-outlook-2022_en) accessed 1 December 2022.
Sala, S., et al., 2019, Consumption and consumer footprint: methodology and results, JRC Technical Report JRC113607, Publications Office of the European Union, Luxembourg (https://eplca.jrc.ec.europa.eu/uploads/LCIND2_Finalreport.pdf) accessed 10 October 2022.
Cover image source: © Mateo Puđa, Well with Nature /EEA


Document Actions
Share with others