Key messages
- Annual mean sea surface temperature has increased in all European regional seas. Further ocean warming is expected in future, potentially exceeding 3 °C by the end of this century under a high-emissions scenario, with somewhat lower warming for the Atlantic than for the other regional seas.
Sea surface temperature
Definition
Sea surface temperature (SST) is a key indicator of climate change in the ocean. SST represents the temperature of sea water at or near the surface over different timescales (e.g. seasonally and annually).
Note that different methods have been used historically to measure SST (ships, buoys and satellites), which requires careful consideration when building homogeneous data sets.
Index factsheet (ETC/CCA Technical Paper): Sea surface temperature
Relevance
The index is easy to interpret and provides information for a variety of applications, mostly related to marine ecosystems and fisheries. Increasing SSTs in coastal areas can trigger algal blooms and outbreaks of vibrio bacteria, which can negatively affect human health and recreation.
Past and projected changes
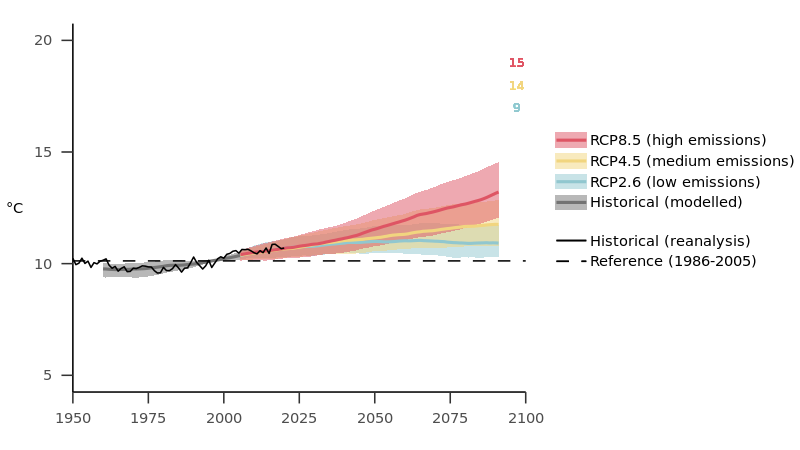
Annual mean SST has increased in all European regional seas since 1870, particularly since the late 1970s.
Further increases are projected in the future, and these could exceed 3 °C by the end of the 21st century under the high-emissions scenario (representative concentration pathway (RCP)8.5). The greatest increases are projected for the Arctic Ocean, the North Sea and the Mediterranean Sea, whereas smaller SST increases are projected for the Atlantic Ocean.
Further information (EEA indicator assessment): European sea surface temperature

Notes: The black line shows the annual values for 1979-2018 from reanalysis data, and the dashed horizontal line shows the mean for 1986-2005. Solid grey, blue, yellow and red lines represent the ensemble median of model simulations for the historical period and under low-, medium- and high-emissions scenarios (RCP2.6, RCP4.5 and RCP8.5, respectively) (smoothed by a 20-year moving average). Shaded areas show the 15th and 85th percentile ranges of the model ensemble. The size of the model ensemble used for each scenario is shown by the coloured numbers in the top-right corner. European seas include all sea surfaces within 25 °W-50 °E and 34 °N-75 °N.
Source: ERA5 and bias-adjusted CMIP5 data.
Notes: The top panel shows the 1986-2005 mean values based on the reanalysis. The central row shows the 15th and 85th percentiles of projected values for near and far future. The projected changes compared with the 1986-2005 reference period are reported on the bottom row.
Source: ERA5 and bias-adjusted CMIP5 data.
Document Actions
Share with others