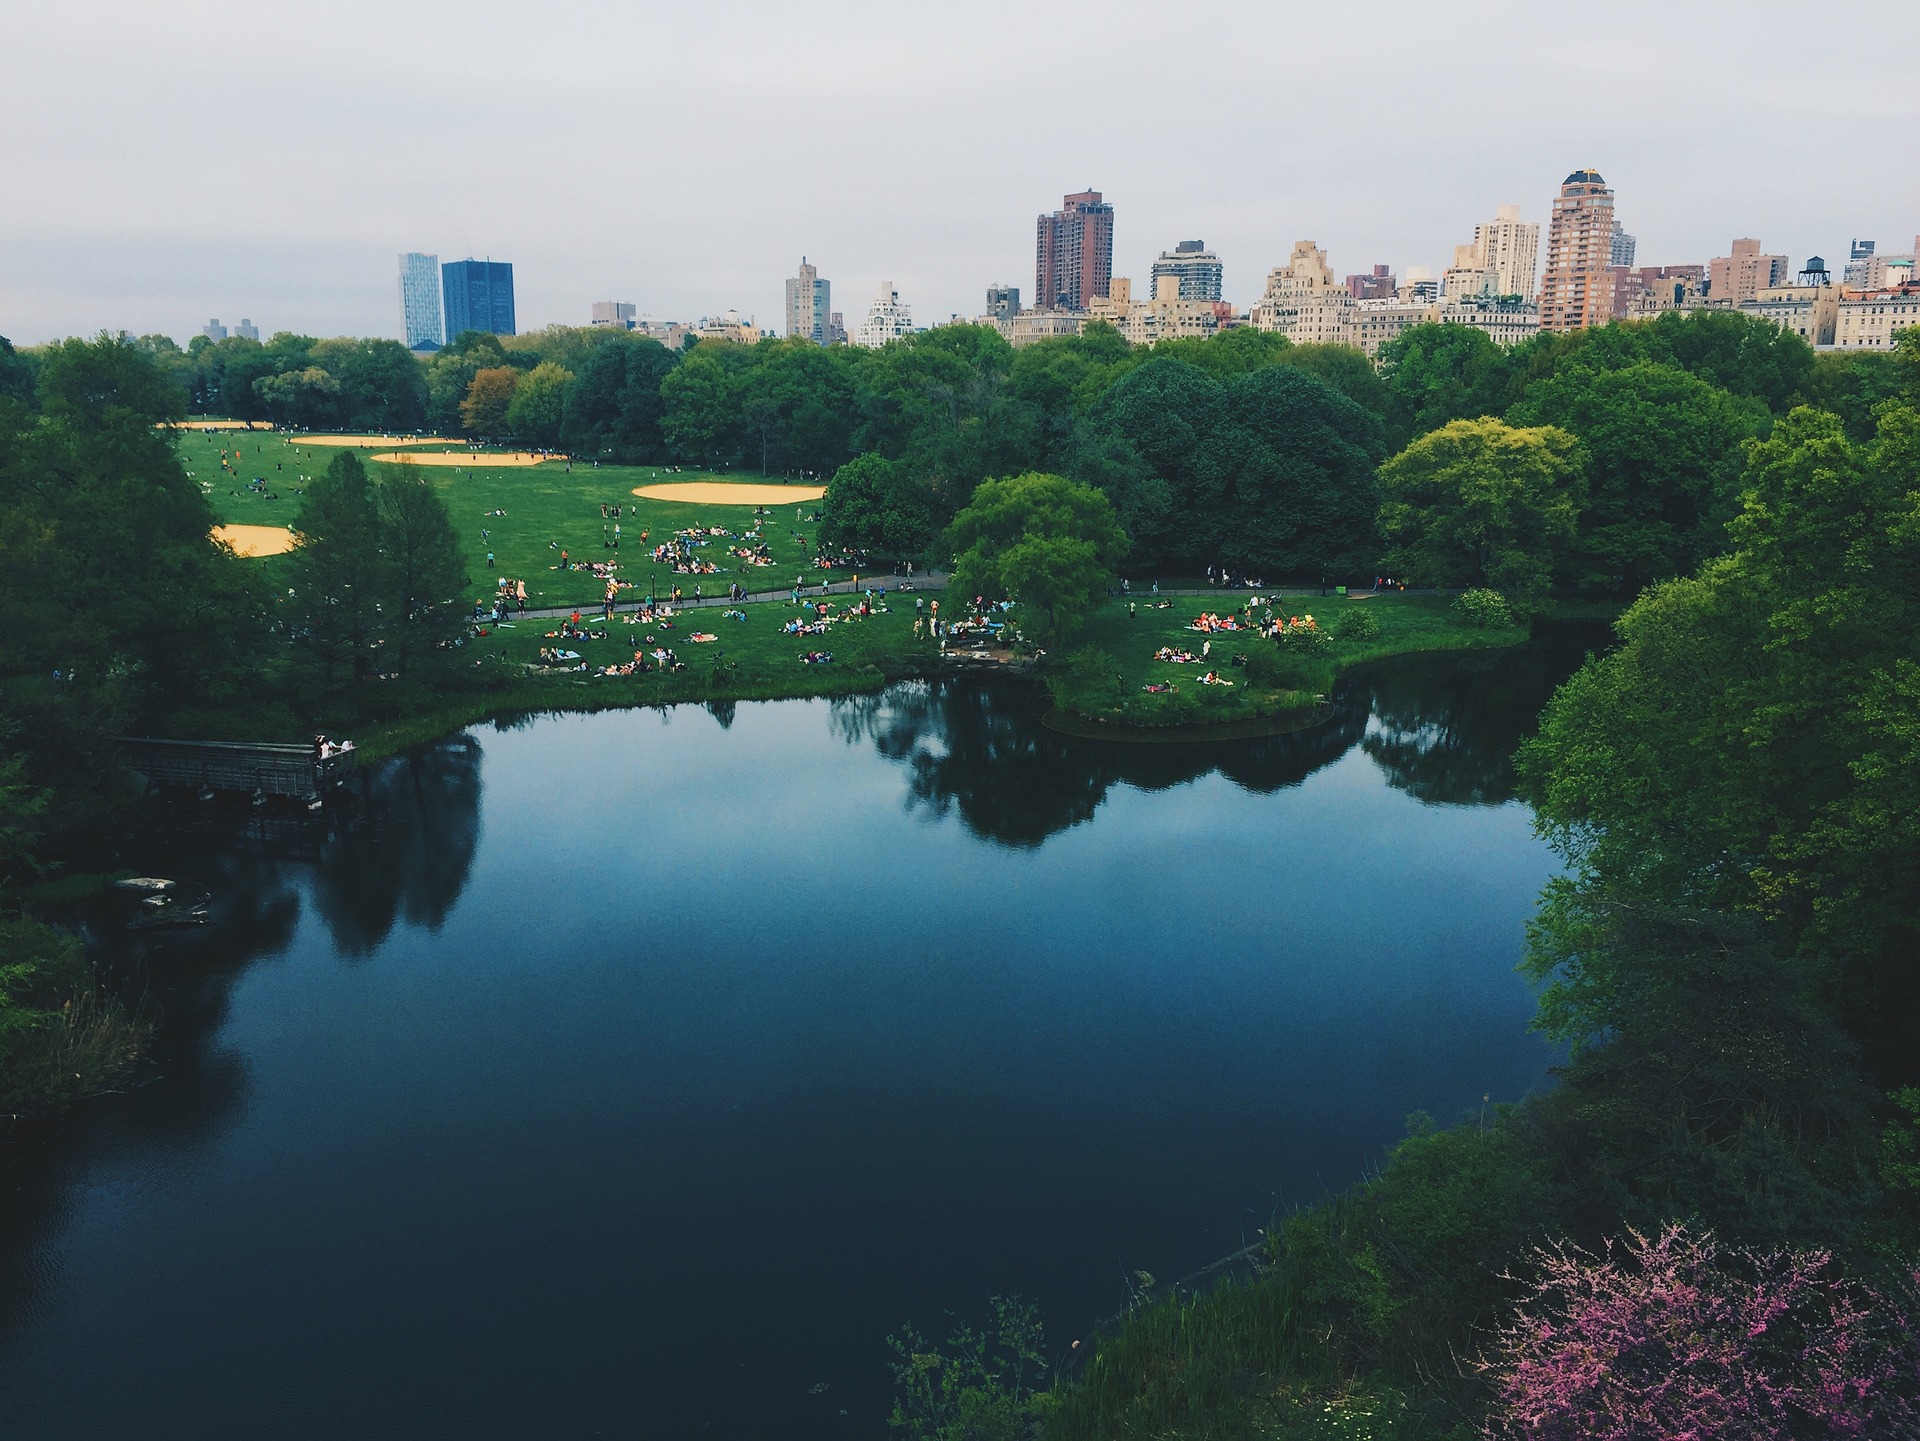
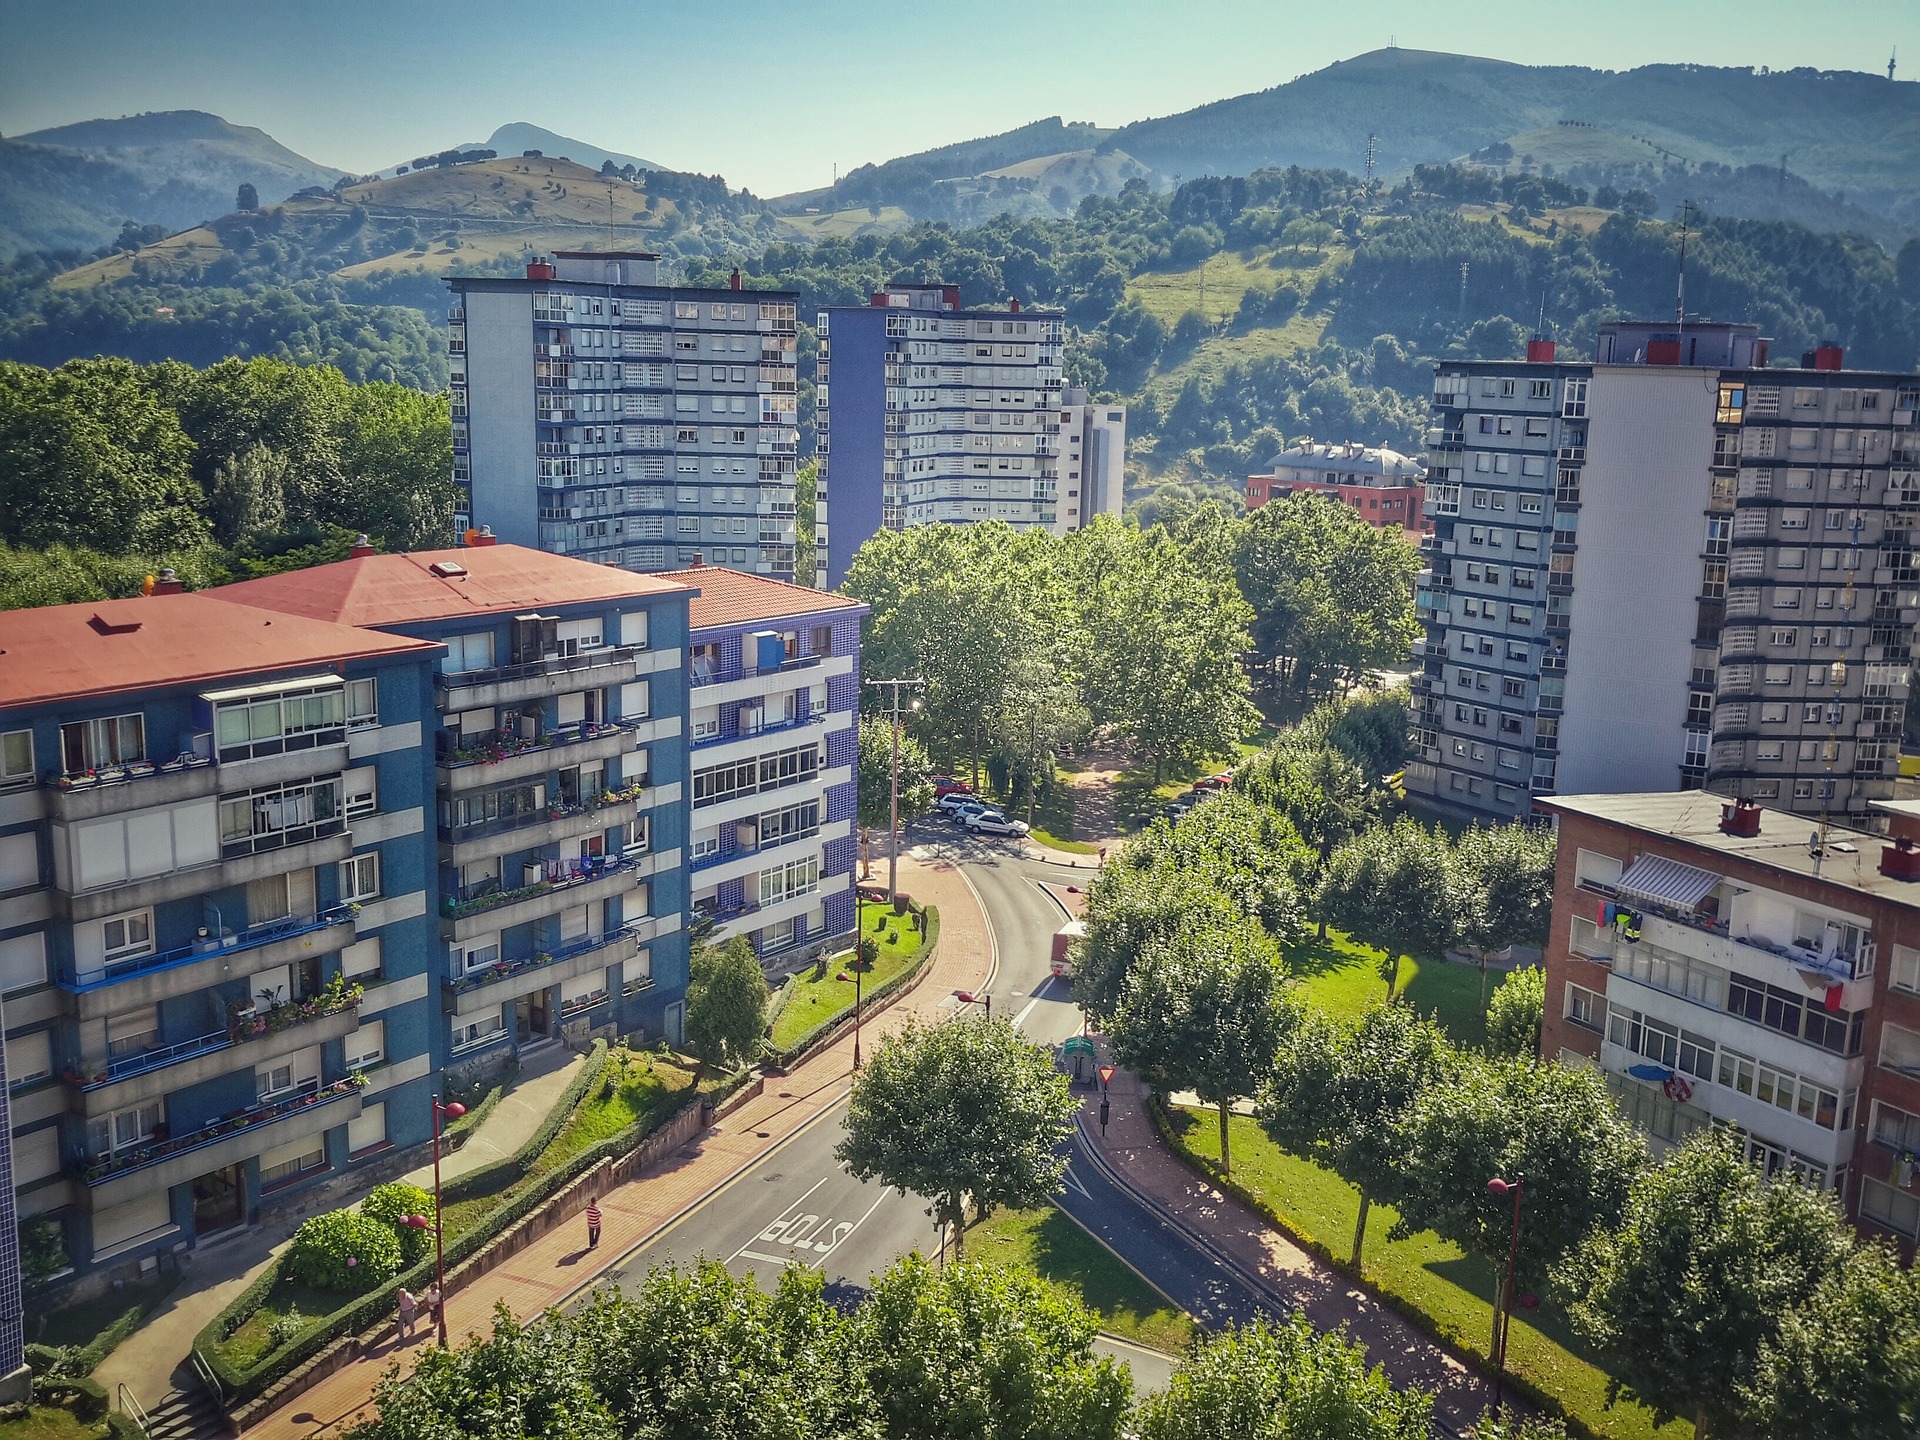
Some of these services will play a key role in the adaptation and mitigation of urban areas to climate change. The cooling effect of vegetation helps to reduce urban temperatures, improving the thermal comfort of urban dwellers and increasing their resilience to heatwave events. Green areas are unsealed, which allows the infiltration of storm water and reduces the risk of floods and their harmful effects.
The flow dynamics and dispersion of local pollutants are affected by the presence or absence of trees in street canyons and can produce significant differences in meteorological and air quality parameters (De Ridder et al., 2004). Moreover, vegetation provides cleaner air by removing nitrogen dioxide and microscopic particulate matter.
Proximity to green urban areas improves both physical and mental health and well-being. In general, green spaces decrease health problems; they reduce blood pressure, cholesterol and stress levels, and increase the general perception of good health.
Moreover, a well-managed and connected network of green infrastructure elements favours the quality and functioning of the urban ecosystems contained in them. These, in turn, increase shelter for biodiversity.

Green infrastructure in the city
At the city level, the EEA proposes two indicators to characterise GI: share of green urban areas and distribution of green urban areas.
Share of green urban areas – How much green do we have?
Green urban areas (GUAs) such as parks, public and private gardens, and even trees lining streets can facilitate climate change adaptation and mitigation, improve health and quality of life, and may favour biodiversity conservation.
Vegetated areas in cities can generate a cooling effect thanks to evapotranspiration and shadowing, which may improve the thermal comfort of urban dwellers and increase their resilience to heatwave events. Moreover, green urban areas are unsealed, allowing the infiltration of storm water and decreasing rainwater runoff.
The presence of GUAs favours pollution control as vegetation provides cleaner air by removing pollutants such as nitrogen dioxide and microscopic particulate matter.
GUAs have an important value beyond their environmental benefits and aesthetic assets. Exposure to greenspaces can restore the physical and mental health of city dwellers by enhancing psychological health and reducing blood pressure and stress levels.
In each of these examples, the proportion of GUAs is defined as the proportion of all vegetated areas within the city boundaries in relation to the total area.
Distribution of green urban areas – Where are these green areas?
Within cities, green areas may not be equally distributed. An uneven distribution of GUAs prevents equal accessibility for all city dwellers, focuses benefits from exposure on fewer city elements (neighbourhoods, streets, buildings or houses) and prevents connectivity of all the available green spaces in the ecological network.
The distribution of GUAs is defined as the relationship between green area boundaries (edges) and all the other elements present in the city. The total length of the edges is compared with the city’s urban area. The edge density provides an indication of the distribution of GUAs. A high edge density in a city indicates a relatively high number of green areas that border residential, commercial, industrial or other public buildings. Consequently, a higher value for the indicator may be due to a long boundary length, i.e. more small patches.
Green infrastructure in the urban-rural interface (peri-urban areas)
The urban-rural interface presents some key attributes of interest for the delivery of multiple ecosystem services such as a multi-functional ecosystem, a dynamic environment, low-density economic activities and an untidy landscape that is potentially rich in wildlife (Gallentet al., 2004). In addition, rural patches in the proximity of built-up areas are vital for sustainable towns and cities as a source of inspiration for urban living that is equally connected to nature and the countryside.

In order to ensure that the main characteristics of green infrastructure at the urban-rural interface are captured, the peri-urban area is defined by the land found in the area from the administrative boundary of the city up to a distance of 50 km away from its centre (Guérois and Pumain, 2008). For this peri-urban transition zone (from urban core to predominantly rural area), two more indicators have been developed: effective green infrastructure and competition for space at the urban–rural interface.
Effective green infrastructure – How much green do we have in the urban-rural interface?
Green infrastructure at the fringes of cities performs similar ecosystem services to that in inner urban areas, though direct benefits from urban-rural interactions are highlighted. Green spaces in the peri-urban area may improve air quality and mitigate climate change. A well connected network of green elements, which form ventilation channels, facilitates the circulation of fresher and cleaner air from the periphery into the city. The vegetated ventilation network may reduce traffic emissions, mitigate noise and provide a cooling effect.
Open areas at the urban fringe may favour species richness. These natural and semi-natural areas generally host a diversity of landscapes as they are dynamic locations surrounded by a variety of land uses. Moreover, GI elements may be used to join urban areas with the neighbouring countryside. This improved connectivity may support the functioning of ecosystems, both urban and rural, mitigating the negative impacts of the built environment.
Moreover, the urban-rural interface forms a vital recreational and cultural pool for urban society that is equally connected to nature and the countryside.
The effective GI indicator is based on the potential distribution of GI in the peri-urban area, that is, the probability to find a GI element in the territory or in the neighbouring area.
Competition for space at the urban–rural interface – Where are potential opportunities for greening?
The urban-rural interface, the area where a city or town meets the countryside, has no clear delineation due to the permeability of its boundaries. It is a dynamic and highly diverse region, where development processes and changes occur at different spatial and temporal scales. The urban fringe is characterised by the trade-off of land uses and the compensation of derived impacts. Here, a strong competition for land use takes place and, accordingly, potential conflicts of interest may arise among a variety of end-users. However, it also presents an opportunity for greening and for connecting existing green spaces to build a solid and functional natural network.
The hotspot percentage identifies those areas where the influence of green spaces and the impact of artificial elements overlap. This indicator provides information about the amount and location of areas where potential conflicts may exist or, from a positive perspective, where management actions present major opportunities for enhancement. On the one hand, high hotspot values may be due to the negative effects of the encroachment of artificial areas into green landscapes and the related loss of ecosystem services and functions. On the other hand, it may represent an opportunity to use green spaces to alleviate the urban heat island effect or to clean up pollution.
References
De Ridder, K., Adamec, V., Bañuelos, A., Bruse, M., Bürger, M., Damsgaard, O., Dufek, J., Hirsch, J., Lefebre, F., Pérez-Lacorzana, J.M., Thierry, A., and Weber, C. 2004, An integrated methodology to assess the benefits of urban green space. Science of the Total Environment vol. 334–335, p 489–497.
Gallent, N., Andersson, J., and Bianconi, M. 2004, Planning on the edge: The context for planning at the rural–urban fringe. Routledge, Abingdon
Guérois, M., and Pumain, D., 2008, Built-up encroachment and the urban field: a comparison of forty European cities. Environment and Planning A 40, 2186–2203. doi:10.1068/a39382
Ong, B.L. 2002, Green plot ratio: an ecological measure for architecture and urban planning. Landscape and Urban Planning 965, 1–15.

Document Actions
Share with others