Key messages
- Annual mean wind speed is generally higher in northern Europe and along coastlines than in southern Europe and inland.
- There is no firm evidence from past data or model projections of major changes in mean wind speed, although the latest data hint at moderately decreasing wind speeds in southern and northern Europe.
Mean wind speed
Definition
The mean wind speed index is a base index representing the average values of wind speed at 10-m height over relatively long timescales (e.g. seasonally or annually).
Index factsheet (ETC/CCA Technical Paper): Mean wind speed
Relevance
This index is particularly relevant for wind power production. While wind speed at 100 m (i.e. near turbine height) would be more relevant for wind power generation, this value is not generally available from measurements and climate model projections. Therefore, 10-m wind speed is generally used as a proxy to assess suitability for wind power.
Past and projected changes
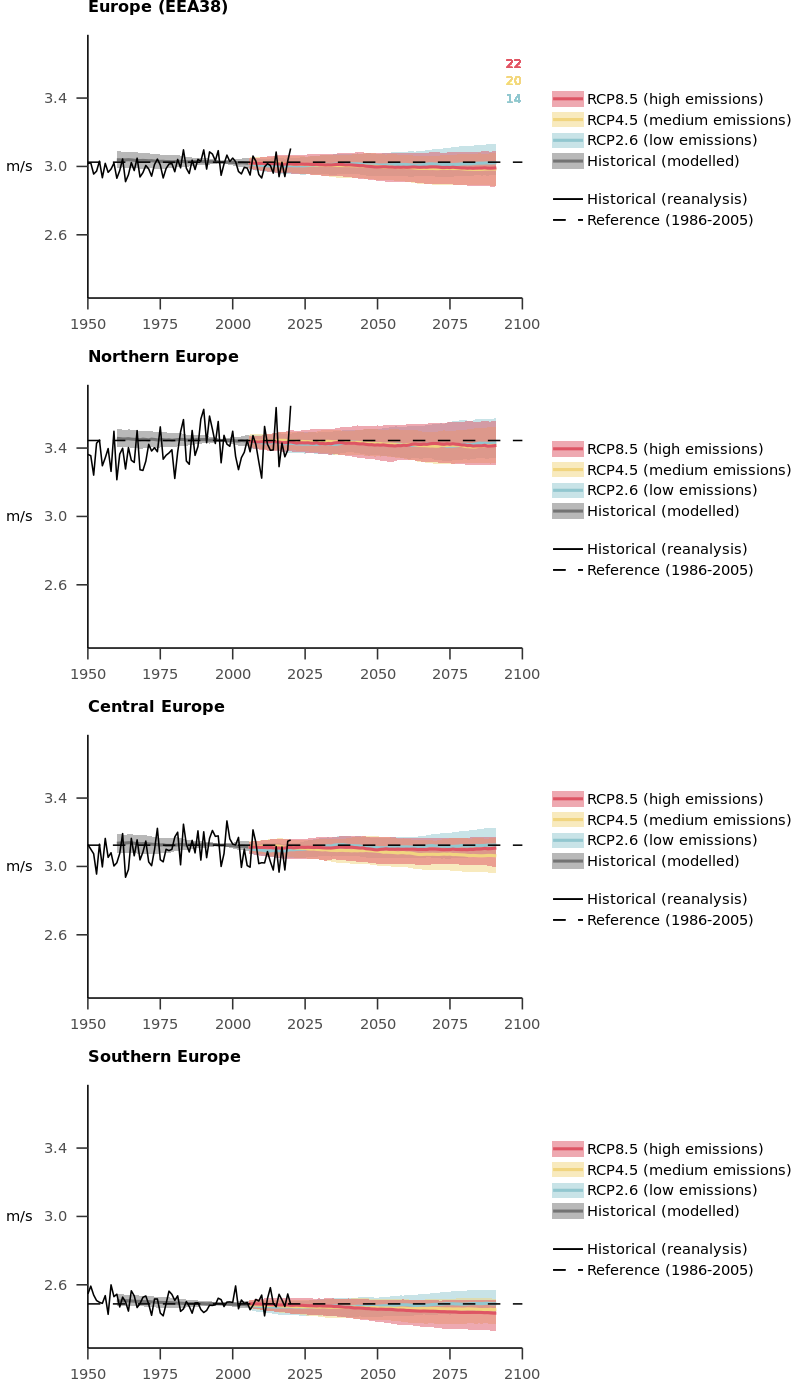
Annual mean wind speed is generally higher in northern Europe and along coastlines than in southern Europe and inland. Neither the reanalysis data from the past nor the CMIP5 model projections underlying the figures presented here show robust changes in mean wind speed, whereas the more recent CMIP6 projections underlying the Intergovernmental Panel on Climate Change’s Sixth Assessment Report suggest that wind speeds are likely to decrease in southern and northern Europe (Coppola et al., 2021: Assessment of the European climate projections as simulated by the large EURO-CORDEX regional and global climate model ensemble; IPCC, 2021: Climate change information for regional impact and for risk assessment)

Notes: The black lines show the annual values for 1950-2020 from reanalysis data, and the dashed horizontal lines show the means for 1986-2005. Solid grey, blue, yellow and red lines represent the ensemble medians of model simulations for the historical period and under low-, medium- and high-emissions scenarios (RCP2.6, RCP4.5 and RCP8.5) (smoothed by a 20-year moving average). Shaded areas show the 15th and 85th percentile ranges of the model ensembles. The size of the model ensemble used for each scenario is shown by the coloured numbers in the top-right corner.
Source: ERA5 and bias-adjusted CMIP5 data.
Notes: The top panel shows the 1986-2005 mean values based on the reanalysis. The central row and bottom row show the projected values and the projected changes, respectively, of the 15th and 85th percentiles for the near and far future. The size of the model ensemble used for each scenario is reported in the time-series figure above.
Source: ERA5 and bias-adjusted CMIP5 data.
Document Actions
Share with others