3. Summary of data reported for summer 1998
The threshold for warning of the public (1h> 360 µg/m3)
was exceeded at two stations in the Athens conurbation (both on more then one day), and on
one station in France (Table 3).
Table 3: Observed exceedance of the threshold for warning of the
public (1h concentration > 360 µg/m3) during summer 1998 (April-August).
| Country |
City |
Station |
Maximum observed hourly
concentration (µg/m3) |
Date, time |
| Greece |
Athens |
Marousi |
421 |
2-7-98, 13:00 |
| Greece |
Athens |
Marousi |
401 |
3-7-98, 12:00 |
| Greece |
Athens |
Lykovrissi |
410 |
2-7-98, 13:00 |
| Greece |
Athens |
Lykovrissi |
425 |
3-7-98, 12:00 |
| Greece |
Athens |
Lykovrissi |
367 |
29-7-98, 13:00 |
| France |
Le Havre |
Notre Dame de
Gravenchon, mairie |
405 |
7-8-98, 11:00 |
During the summers of 1996 and 1997 the threshold for warning of the
public was also exceeded in the Athens conurbation, although partly on different stations.
The Athens episode will be described in more detail in Chapter 4. The French exceedance
occurred in an isolated industrial area near Le Havre during a day with only a few other
French stations reporting concentrations above 180 µg/m3.
Table 4 presents a general overview of the observed exceedances of the threshold for
information of the public during April-August 1998 on a country by country basis. As the
number of stations differs widely from country to country, the absolute number of
exceedances is less suitable for comparison. As in the annual ozone report [De Leeuw and
De Paus, 1998], the concept of 'occurrence of exceedances' is used here. Occurrence of
exceedances is defined as the total number of exceedances summed over all stations divided
by the number of stations.
Table 4: Summary of exceedances of the threshold for information of the public (1h
concentration > 180 µg/m3) during summer 1998 (April-August) on a country
by country basis.
| |
Nr. of stationsI
|
Nr. of stations with
exceedance |
Nr. of days with
exceedanceII |
maximum observed
concentr. (µg/m3) |
averaged maximum
concentr. (µg/m3) |
Occurrence of
excee-dancesIII |
average duration of
exceedances (hour) |
| AT |
113 |
54 (48%) |
20 |
284 |
199 |
1.2/2.5 |
2.5 |
| BE |
26 |
21 (81%) |
7 |
238 |
196 |
2.0/2.5 |
2.9 |
| DE |
387 |
273 (71%) |
31 |
287 |
200 |
2.7/3.9 |
3.2 |
| DK |
5 |
0 |
- |
<180 |
<180 |
- |
- |
| ES |
70 |
57 (81%) |
74 |
316 |
200 |
3.3/4.0 |
2.1 |
| FI |
11 |
0 |
- |
<180 |
<180 |
- |
- |
| FR |
234 |
174 (74%) |
65 |
405 |
199 |
3.1/4.2 |
2.2 |
| GB |
71 |
15 (21%) |
13 |
340 |
208 |
0.3/1.3 |
1.9 |
| GR |
14 |
8 (57%) |
53 |
425 |
234 |
8.3/14.5 |
2.9 |
| IE |
6 |
0 |
- |
<180 |
<180 |
- |
- |
| IT |
65 |
16 (25%) |
41 |
290 |
203 |
1.5/5.9 |
2.7 |
| LU |
5 |
4 (80%) |
8 |
230 |
195 |
3.4/4.3 |
2.8 |
| NL |
39 |
29 (74%) |
10 |
262 |
200 |
1.7/2.3 |
2.8 |
| PT |
14 |
3 (21%) |
8 |
259 |
206 |
0.9/4.3 |
1.5 |
| SE |
6 |
0 |
- |
<180 |
<180 |
- |
- |
| EU |
1066 |
654 (61%) |
|
425 |
201 |
2.4/3.9 |
2.7 |
I Number of stations implemented in the framework of the Ozone Directive
II The number of days on which at least one exceedance was observed
III Left figure: averaged over all implemented stations, right figure: averaged
over all stations which reported at least one exceedance.
Denmark, Finland, Ireland and Sweden did not observe exceedances of the population
information threshold this summer. The same countries did not report any exceedances last
year. In other countries, the number of days on which at least one exceedance was observed
ranged from 7 in Belgium to 74 in Spain. 61 % of all stations reported one or more
exceedance. On average 3.9 exceedances occurred this year on stations which recorded at
least one exceedance. The average maximum hourly concentration during an exceedance of the
threshold this year was 201 µg/m3.
Table 5 summarises the exceedances on a month by month basis. The relative abundance of
observed exceedances in May can be attributed mainly to an early stable period of warm
summer weather in Western Europe. April, June and July were on average unfavourable for
the formation of ozone in Northern and Western Europe. August had the highest number of
stations reporting exceedances and the highest occurrence, due to one period of favourable
ozone formation conditions in Western Europe.
Table 5: Summary of exceedances of the threshold for information of the public (1h
concentration > 180 µg/m3) during summer 1998 (April-August) on a month by
month basis.
| |
Nr. of stations with
exceedanceI |
maximum observed
concentration (µg/m3) |
averaged maximum
concentration (µg/m3) |
Occurrence of
exceedancesII |
average duration of
exceedances (hr) |
| April |
10 |
340 |
204 |
0.0/2.0 |
2.0 |
| May |
236 |
290 |
193 |
0.4/1.8 |
2.5 |
| June |
127 |
341 |
200 |
0.2/1.9 |
2.1 |
| July |
154 |
425 |
209 |
0.3/2.0 |
2.2 |
| August |
569 |
405 |
202 |
1.4/2.7 |
3.0 |
I The theoretical maximum is 1066 stations (all stations which are assumed to be
operational during summer 1998 and for which data was transmitted).
II Left figure: averaged over all implemented stations, right figure: averaged
over all stations which reported at least one exceedance.
In Figure 1 the number of days per month is presented on which at least at one station
in a country an exceedance was recorded. No obvious monthly dependence is apparent. In the
Northern and Western countries Austria, Germany, Luxembourg, Belgium and the Netherlands,
August was the month with the highest number of days with exceedances observed. In the
Mediterranean region most days with exceedances were observed in July, with the exception
of Greece (August). In Portugal exceedances were only observed in August.
Figure 2 presents the occurrence of exceedances per country on a month by month basis.
Again, there is no obvious dependence on the month.
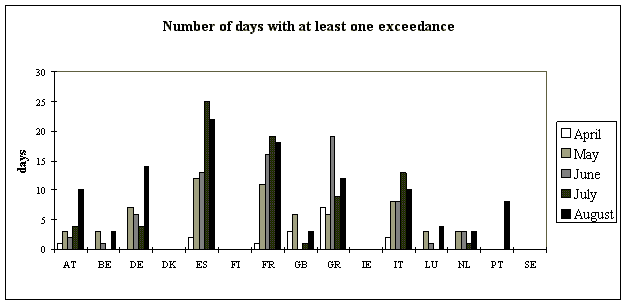
Figure 1: Number of days on which at least one exceedance of the threshold value for
information of the public (1h concentration > 180 µg/m3) was observed per
country and per month during summer 1998. Finland, Denmark, Sweden and Ireland did not
report exceedances.
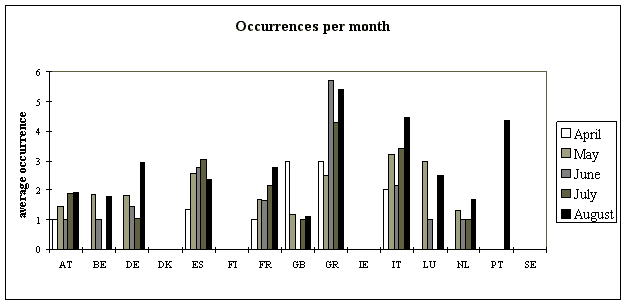
Figure 2: Occurrence of exceedances of the threshold value for information of the
public (1h concentration > 180 µg/m3) per country on a month by month basis
during summer 1998. Finland, Denmark, Sweden and Ireland did not report exceedances.
The average occurrence of exceedances (in days) in each country of the threshold for
information of the public by station type (rural, urban and street) is presented in Figure
3. Stations for which the type was not specified are not presented in this figure. The
average occurrence rate is expected, according to ozone phenomenology, to decrease in
general in the order rural-urban-street. For some countries, this decrease is apparent. In
other countries, this relation is not visible or even contradicts.
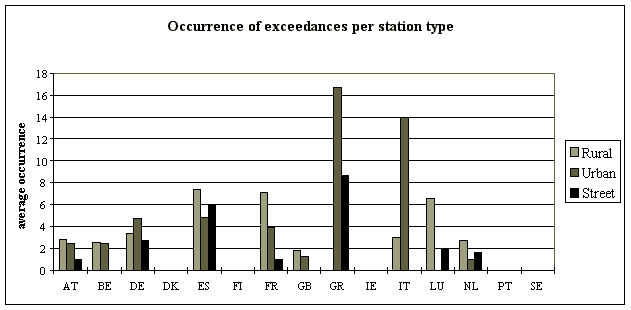
Figure 3: Average occurrence of exceedances (in days) of the threshold for
information of the public (1h concentration > 180 µg/m3) by station type
(rural, urban and street) and country during summer 1998. Finland, Denmark, Sweden and
Ireland did not report exceedances.
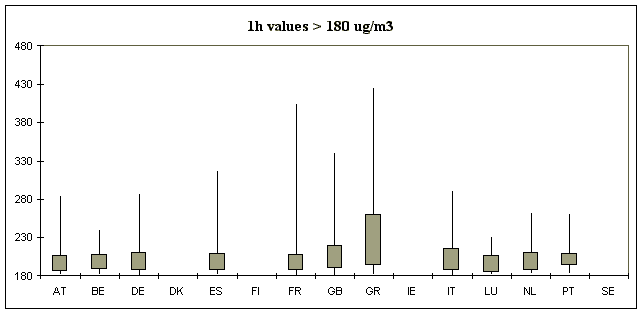
Figure 4 shows the frequency distribution of hourly ozone concentrations in excess of
the threshold value using Box-Jenkins plots. For each Member State the Box-Jenkins plot
indicates the minimum (here the minimum is 180 µg/m3), the maximum, the 25
percentile and the 75 percentile value of the exceedances. The figure shows that during
25% of all observed exceedances, the maximum hourly concentration recorded was just above
the 180 µg/m3 threshold. 75% of all maximum exceedances recorded were below
214 µg/m3.
| |
AT |
BE |
DE |
DK |
ES |
FI |
FR |
GB |
GR |
IE |
IT |
LU |
NL |
PT |
SE |
#Ex |
137 |
52 |
1052 |
0 |
229 |
0 |
732 |
21 |
116 |
0 |
95 |
17 |
68 |
13 |
0 |
#St |
54 |
21 |
273 |
. |
57 |
. |
174 |
15 |
8 |
. |
16 |
4 |
29 |
3 |
. |
Figure 4: Frequency distribution of ozone concentrations in excess of the 180 µg/m3
threshold for hourly values (April-August 1998). Frequency distributions are
presented as Box-Jenkins plots indicating the minimum, the 25-Percentile, the
75-Percentile and the maximum value.
3.1 Geographical distribution
Maps 2 and 3 show the geographical distribution of the number of days on
which the threshold value for information of the public was exceeded for urban1 and rural stations, respectively. Exceedance data for urban stations are presented as
dots. The exceedance data for rural stations are interpolated using simple inverse
distance weighting and a tentatively estimated 'radius of representativeness' of 100 km.
Note that this radius might be different for the various regions in Europe.
The spatial pattern of exceedances observed this summer on urban
stations and on stations of unspecified type is comparable to that observed during the
previous summer. The number of exceedances observed in Northern and Western Europe
increases from zero in Ireland, Denmark, Sweden and Finland to more than 10 on some
stations in Southern Germany. The number of exceedances observed in the UK, Netherlands,
Belgium and the Northern half of Germany is slightly lower than last year. No consistent
spatial pattern is apparent in the Mediterranean region. Many stations did not report
exceedances, while other stations reported more than 10 exceedances.
The spatial pattern of exceedances observed this summer on background
stations (interpolated field) is also comparable to the field observed in the previous
summer.
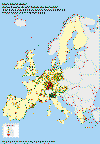
Map 2: Number of exceedances of the threshold value for the
information of the public (1h > 180 µg/m3) observed at urban/street
stations and stations of unspecified type. Summer 1998 (April-August).
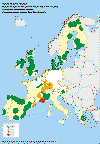
Map 3: Number of exceedances of the threshold value for the
information of the public (1h > 180 µg/m3) observed at background
stations. Summer 1998 data (April-August), interpolated using inverse distance weighting,
cut-off distance of 100 km.
3.2 Comparison with earlier years
Exceedances observed during the 1998 summer period were compared to
exceedances observed during the same period in 1997, 1996 and 1995.2
Figure 5.a presents the average exceedance duration3
of the population information threshold, Figure 5.b the average occurrence and Figure 5.c
presents the average maximum concentration observed during exceedances. The figures for
1997 are different from those presented in the 1997 summer report [Sluyter and van
Zantvoort, 1997] because in the present report data from France and Italy could be
included.4

Figure 5.a: Average duration in hours of exceedances during the
summer period (April-August, French and Italian data were not included in 1995 and 1996).

Figure 5.b: Average occurrence (nr) of exceedances at stations which reported at
least one exceedance during the summer period (April-August, French and Italian data were
not included in 1995 and 1996).

Figure 5.c: Average maximum concentration (µg/m3)
observed during exceedances during the summer period (April-August, French and Italian
data were not included in 1995 and 1996)
It is difficult to assess a possible trend in the number, duration and
severity of exceedances of the threshold for information of the public which in its turn
could indicate a possible trend in precursor emissions, because:
- As indicated, French and Italian data were not included in the 1995 and
1996 data analysis. From a comparison for 1997 with the indicators calculated with and
without the French data, it is expected that the average duration, occurrence and maximum
would increase for 1995 and 1996 if Italian and French data were included.
- High ozone levels (in this case exceedances of the population information
threshold) are mainly observed during periods with warm and sunny weather. Especially in
western and northern Europe, the year-to-year variations in meteorological conditions
favourable for high ozone levels are large. The resulting variations in exceedance
statistics can obscure a possible trend due to changes in pre-cursor emissions. It is at
the moment not possible to correct for this variability on a country by country basis nor
for the complete EU territory;
- Exceedances statistics are available for only four years which is a very
short time series to asses a possible trend;
- The number of stations implemented in the framework of the Ozone
Directive increased with ca. 20% during the period 1995-1997 and remained at the 1997
level this year. The increased territorial coverage can have implications for the number
of exceedances observed. Also, a changing ratio between the number of rural and
urban/street stations can have implications for the number of observed exceedances since
peak ozone levels will on average be lower in urban areas then in rural areas.
All three indicators are slightly higher than in the 1997 summer period
but lower than in 1995 and 1996.
1Exceedances reported from stations
of unspecified type are also plotted in this map.
2 1995, 1996, 1997: Validated exceedance
statistics as transmitted by Member States were used for this purpose.
3 Averaged over all stations which reported at least one
exceedance.
4Data from France and Italy were not
included in the calculations for 1995 and 1996; data was missing, incomplete or
inconsistent.


Document Actions
Share with others