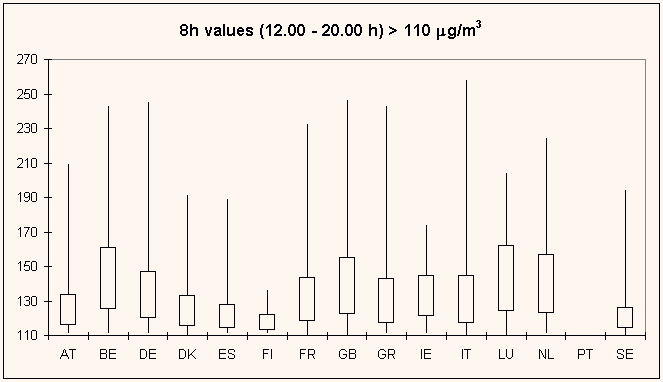
Frequency Distribution Of Ozone
Concentrations
| |
AT |
BE |
DE |
DK |
ES |
FI |
FR |
GB |
GR |
IE |
IT |
LU |
NL |
PT |
SE |
| #ex |
4254 |
607 |
11429 |
69 |
1035 |
53 |
1966 |
441 |
538 |
86 |
1273 |
155 |
945 |
n.a. |
68 |
| #st |
110 |
20 |
342 |
6 |
80 |
11 |
97 |
32 |
10 |
6 |
44 |
5 |
37 |
4 |
6 |
|
n.a = number of exceedances not
available

Figure 2. Frequency distribution of ozone concentrations
(eight-hourly values; period 12.00-20.00) in excess of the 110
µg/m3 threshold for hourly values. For each
country the total number of observed exceedances is given in row
'#Ex', the number of stations is given in row '#St'. Frequency
distributions are presented as Box-Jenkins plots indicating the
minimum, the 25-Percentile, the 75-percentile and the maximum
value. The data for Portugal did not allow for inclusion in this
figure.


Document Actions
Share with others