next
previous
items

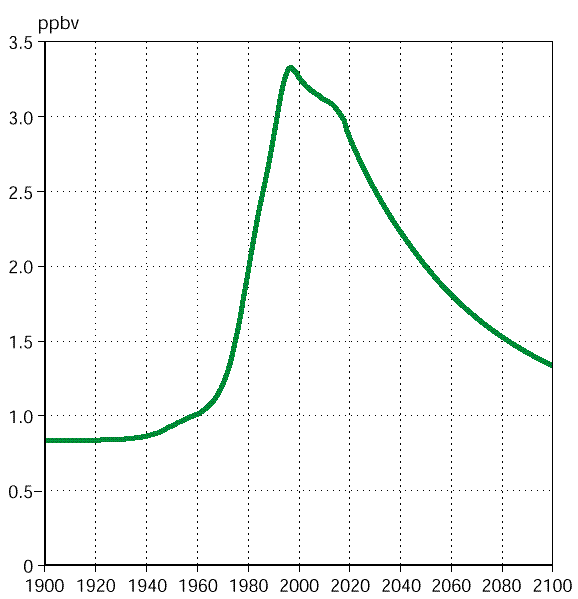
Figure: Ozone depleting substances in the stratosphere, 1950-2100

Ozone depleting substances in the stratosphere, 1950-2100

Ozone depleting substances in the stratosphere, 1950-2100


Source: RIVM, preliminary data from the WMO 1998 ozone assessment.

Note: The curve shows the projected mixing ratio (frequency of occurrence) of so-called equivalent effective chlorine. It is based on the Protocol scenario in the 1998 WMO/UNEP ozone assessment, which assumes maximum allowed emissions within protocols.

Back to conclusions

Permalinks

Document Actions