Emissions
in Europe in 1990
Introduction
It is important to consider the
sources of air pollution on an international scale. This chapter therefore identifies the
most important source sub-sectors for Europe as a whole.
The ten most important sources of
air pollution are presented here as the top ten source sub-sectors for every
pollutant to indicate the most important sources of air emissions in Europe. These top ten
sub-sectors provide guidance to possible emission reduction strategies in Europe, because
with the exception of NMVOC and CO2, they are responsible for more than 90% of
total emissions.
Top Ten Source Sub-Sectors
CORINAIR 90 evaluates emissions for
eight pollutants. In general these pollutants can be divided into two groups according to
their sources. Group one are pollutants mainly caused by the combustion of fossil fuels.
These pollutants are:
Group two are pollutants caused predominantly by agricultural and natural sources.
These are:
The remaining pollutant NMVOC covers
many different substances which can be traced to a wide range of emission sources.
Figure 1 shows the top ten source
sub-sectors for the pollutants evaluated in CORINAIR 90. For detailed data see also
Appendix C. The emissions from other sources than the top ten source sub-sectors are
indicated as other polluters.
Figure 1 Top ten source sub-sectors for Europe (1990)
About 80% of the SO2 and CO2
emissions are caused by the same seven source sub-sectors. The top sub-sector is the same
for both pollutants (Public Power and Cogeneration Plants), the second and third alter
their positions. Emissions of nature are important for both pollutants (SO2:
top six, CO2: top seven).
The emissions of NOx are dominated by Road Transport and Other Mobile
Sources. Considering the top three sub-sectors for SO2 and CO2 only
the top sub-sector is within the top three ranking of NOx. Commercial,
Institutional and Residential Combustion Plants ( top two sub-sector for SO2
and top three sub-sector for CO2 ) is only in the bottom half of the top ten source
sub-sectors for NOx.
The top ten source sub-sectors of CH4 and NH3 are dominated by
Nature and Agriculture. Six of the top ten source sub-sectors are relevant for both CH4
and NH3. However the ranking of the top ten and their relative contribution are
different for each pollutant. Five top ten source sub-sectors of NH3 and of CH4
are within the top ten ranking of N2O. Contrary to NH3 and CH4,
there are two source sub-sectors within the N2O top ten ranking, which cause
emissions by combustion of fossil fuels. Emissions of Production Processes are only
relevant for NH3 and N2O but not for CH4.
Five of the NMVOC top ten source sub-sectors consist of polluters, which can be found
within the ranking of all the previous pollutants. The ranking is especially dominated by
sub-sectors like Road Transport (top one, six and nine), Nature (top two and five) and
Solvent use (top three, four and eight).
More than 50% of the CO emissions
are caused by Road Transport, two of the three sub-sectors from this sector being also
within the top ten ranking of NMVOC. Top two and top three are identical to those of CO2
. Top four and top seven are sub-sectors which are not found in the top ten ranking of any
other pollutant.
Thirty eight of the 57 source sub-sectors are featured in the top ten of the eight air
pollutants investigated. However only 13 of the 38 show a contribution larger 10% to the
total emissions of one or more of the eight pollutants (see appendix A). The following
five source sub-sectors have been identified as the top sub-sectors (see table 1).
Table 1 Top source sub-sectors for the pollutants investigated in CORINAIR90
| Source sub-sector |
Pollutant |
| Public Power and Cogeneration Plants |
SO2, CO2 |
| Road Transport - Passenger Cars |
NOx,CO, NMVOC |
| Agriculture - Animal Breeding (enteric
fermentation) |
CH4 |
| Agriculture - Animal Breeding
(excretions) |
NH3 |
| Agriculture - Cultures with Fertilizer
(except animal manure) |
N2O |
The following sections will discuss the sources of emissions in Europe pollutant by
pollutant. The idea is not to deal with every source, but rather to draw attention to the
most significant features on a sub-sector and activity basis.
SO2
OVERVIEW
In 1990 28 million tonnes of SO2 were emitted in Europe. These emissions can
be traced to relatively few sub-sectors. 81% derive from the top three sub-sectors (see
figure 2) and 95% from the top ten.
Figure 2 Major source sub-sectors for SO2 in percentage of European total
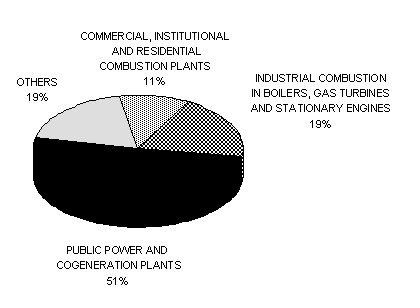
The emissions from SO2 in Europe can be traced to a few important sources.
More than half of all European emissions derive from Public Power and Cogeneration Plants
(SO2 top one). The next chapter discusses emissions for the four most important
sub-sectors in more detail which together account for 85% of Europe s SO2.
DISTRIBUTION OF MOST
IMPORTANT SOURCE SUB-SECTORS
Despite improving abatement technologies Public Power and Cogeneration Plants are still
by far the most important source for SO2 (SO2 top one). 49% of the
European total (28 million tonnes) of SO2 is emitted by 478 European plants
(large point sources, LPS) with a thermal capacity over 300 MW (see figure 3), the top 100
accounting for 39% and the top ten for 12%
In the CORINAIR 90 inventory they have been evaluated separately as large point sources
(LPS) whose exact location is known. More details to LPS will be provided in another
report of the EEA describing the results of CORINAIR 90.
Figure 3 Distribution of SO2 emission by activity within the top source
sub-sector
Public Power and Cogeneration Plants

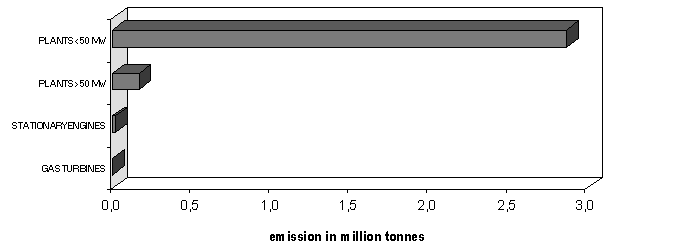
The SO2 emission from Industrial
Combustion in Boilers, Gas Turbines and Stationary Engines (SO2 top two) is not
as focused as the previous group (see figure 4). The main part is caused by small plants
with a thermal capacity of less than 50 MW. These emissions have been reported almost
entirely as area sources. Only 212 plants are responsible for the emissions of plants with
a thermal capacity over 300 MW in Europe and contribute 6% of Europes total.
Stationary Engines and Gas Turbines are not significant sources of European SO2
emissions.
Figure 4 Distribution of SO2 emission by activity within second top source
sub-sector
Industrial Combustion in Boilers, Gas Turbines and Stationary Engines

Commercial, Institutional and Residential Combustion
Plants are the third most important source of SO2 emissions in Europe (SO2
top three). Almost all emissions are produced by small plants (see figure 5) and almost
all of these are reported as area sources.
Figure 5 Distribution of SO2 emission by activity within third top source
sub-sector
Commercial, Institutional and Residential Combustion Plants
Sinter plants (see figure 6) are the leading source
of emissions for Industrial Combustion - Processes with Contact (SO2 top four).
Figure 6 Distribution of SO2 emission by activity within fourth top source
sub-sector
Industrial Combustion - Processes with Contact

The ranking of the SO2 top five
sub-sector District Heating Plants is not very certain because many countries assigned
their emissions to other sources (see also section two national emissions and
appendix D).
Of minor importance, but nevertheless of interest, are the emissions from volcanoes (SO2
top six). As we will see in section two, only one country (Italy) reported such
emissions. It is the only important natural source of SO2 emission,
nevertheless volcanic eruptions contributed 2% of the European total in 1990.
Road Transport is not very significant for SO2 emissions with one exception.
Heavy Duty Vehicles over 3,5 tonnes and Buses (SO2 top eight) are responsible
for 1% of the European total.
CO2
OVERVIEW
4,7 billion tonnes CO2 were emitted in 1990. The three most important
sub-sectors (see figure 7) are the same as for SO2. However, Public Power and
Cogeneration Plants are not so dominant and the three biggest sub-sectors are only
responsible for 60% of the European total in comparison with 81% for SO2.
Figure 7 Major source source sub-sectors for CO2 in percentage of European
total

DISTRIBUTION OF MOST IMPORTANT SOURCE
SUB-SECTORS
The distribution pattern of the three biggest CO2 sources is not presented
here because their distribution pattern is very similar to that of the three largest
sources of SO2.
It is interesting to note that Passenger Cars are responsible for 8% of European CO2
emissions (CO2 top four). Urban driving produces more CO2 than rural
and highway traffic (see figure 8).
Figure 8 Distribution of CO2 emission by activity within fourth top source sub-sector
Road Transport: Passenger Cars

Natural sources seem to be not very important for
the European CO2 emissions. Natural CO2 emissions including e.g.
Nature-Animals (CO2 top seven) have only been reported by seven countries.
There is now general consensus that CO2 emissions from animals (and humans)
should not be included in emission inventories since such CO2 is quickly
recycled and hence those sources of CO2 will not be qualified in subsequent
inventories or the update of 1990 inventory.
NOx
OVERVIEW
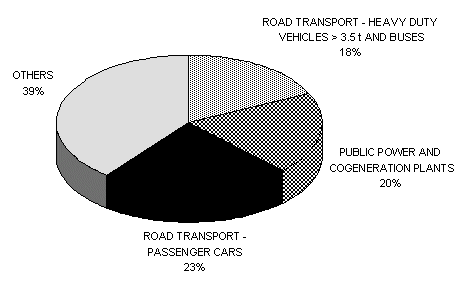
Europe emitted 18 million tonnes of NOx in 1990. Road transport (NOx
top one and three) and Power Plants (NOx top two) play a dominant role in the
production of NOx emissions (see figure 9). The top three sub-sectors together account for
61% of total NOx.
Figure 9 Major source sub-sectors for NOx in percentage of European total
DISTRIBUTION OF MOST IMPORTANT SOURCE SUB-SESTORS
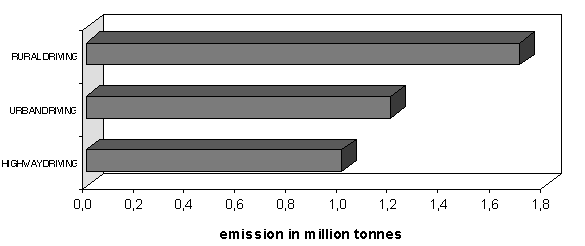
Within the top source sub-sector the use of passenger cars in rural locations is the
most important source of NOx pollution in Europe claiming 10% of the total (see
figure 10).
Figure 10 Distribution of NOx emission by activity within top source
sub-sector
Road Transport - Passenger Cars
The distribution pattern for Public Power and
Cogeneration Plants (NOx top two) is quite similar to that of SO2
where plants larger than 300 MW are the dominant source and is therefore not presented
here.
The third biggest source is Heavy Duty Vehicles > 3,5t and Buses with 18% of the
European total. Here, in contrast to Passenger Cars, highway traffic contributes more than
urban traffic (see figure 11).
Figure 11 Distribution of NOx emission by activity within third top source
sub-sector
Road Transport - Heavy Duty Vehicles >3,5t and Buses

Note: Some European countries only estimated
emissions for the sub-sector Road Transport - Heavy Duty Vehicles as a whole and did not
distinguish between rural, urban and highway driving. Here the emissions from these
countries have been assigned to the not distributed bar in figure 11 and
following.
The pattern of the fourth biggest NOx sub-sector Industrial Combustion in
Boilers, Gas Turbines and Stationary Engines is quite similar to that of SO2
and is therefore not presented here (see figure 4).
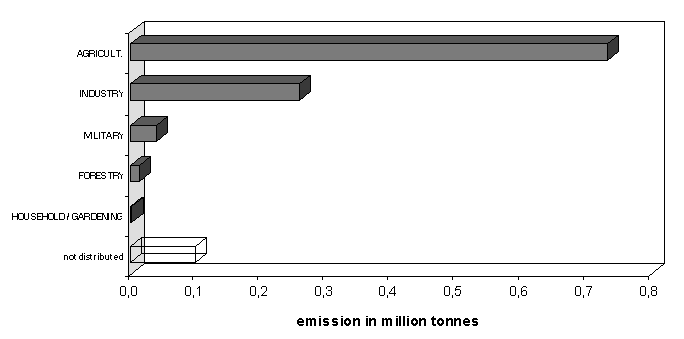
An interesting point is that Other Mobile Sources (NOx top five) contributed
6% of the European total with major emissions from the agricultural use of other mobiles
(see figure 12). About two third of the countries estimated emissions for this sub-sector.
If allocated correctly this sub-sector would contribute more than 6%.
Emissions from nature are almost non-existent for NOx. Perhaps here too, are
emissions yet to be considered (e.g. lightning, forest fires).
Figure 12 Distribution of NOx emission by activity within fifth top source
sub-sector
Other Mobile Sources - Off Road Vehicles and Machines
CO
OVERVIEW
The European total for CO emissions in 1990 reached 70 million tonnes. Again Passenger
Cars are by far the most important source for CO as for NOx (see figure 13). It
is interesting to note that as far as road transport is concerned, light duty vehicles are
more important than heavy duty vehicles in contrast to NOx emissions. The top
three sub-sectors account for 67 % of CO.
Figure 13 Major source sub-sectors for CO in percentage of European total
DISTRIBUTION OF MOST IMPORTANT SOURCE SUB-SECTORS
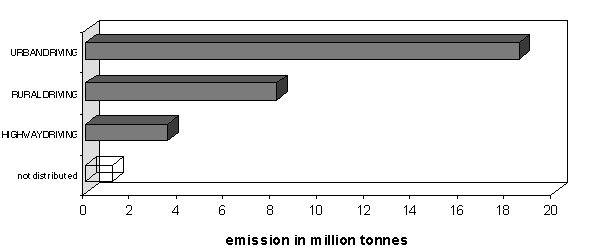
The distribution pattern of CO top one is different to that of NOx top one:
urban traffic is much more important than rural and highway traffic (see figure 14) due to
higher CO emission rates during cold starts and higher NOx emission rates
during highway driving.
Figure 14 Distribution of CO emission by activity within top source sub-sector
Road Transport: Passenger Cars
The distribution pattern of CO top two is quite
similar to SO2 top three (see figure 5) and is therefore not presented here.
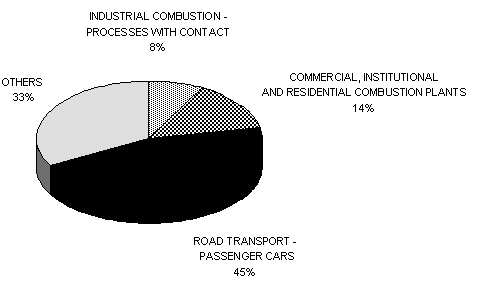
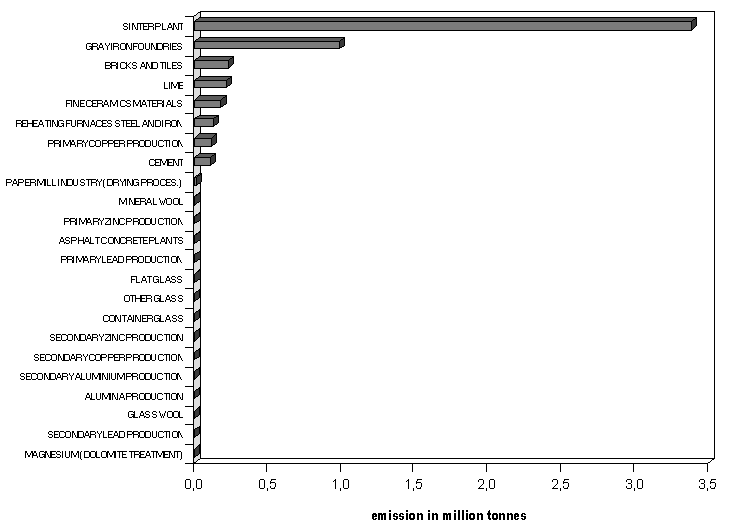
The third biggest source for CO is Industrial Combustion - Processes with Contact which is
responsible for 8% of the European total CO emission. Here the main source of CO as for SO2
is Sinter Plants (see figure 15).
Figure 15 Distribution of CO emission by activity within third top source sub-sector
Industrial Combustion - Processes with Contact
Open Burning of Agricultural Wastes is top four of CO producing 6% of the European
total. The CORINAIR 90 inventory did not investigate this sub-sector any further. Only ten
countries estimated emissions for this sub-sector. This may indicate that this source of
CO pollution is important only in some European countries or that the emissions of this
sub-sector have not been estimated or that its emissions are included elsewhere.
Emissions from nature are of no significance to the top ten sub-sectors for CO.
CH4
OVERVIEW
The top three source sub-sectors Agriculture - Animal Breeding (Enteric Fermentation),
Waste Treatment and Disposal - Land Filling and Extraction and 1st Treatment of Solid
Fuels are responsible for 55% of the 45 million tonnes of CH4 emitted in 1990
in Europe (see figure 16).
Figure 16 Major source sub-sectors for CH4 in percentage of European total
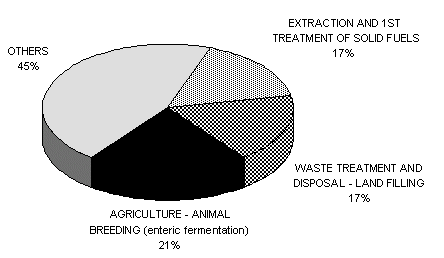
In contrast to the pollutants discussed so far, CH4
emissions from the combustion of fossil fuels are relatively unimportant. Agriculture is
the main sub-sector in Europe for CH4 where the main source, Animal Breeding is
responsible for 21% of the total emission.
DISTRIBUTION OF MOST
IMPORTANT SOURCE SUB-SECTORS
Taking a closer look at the top-ranking sub-sector for CH4, the dominant
role of cattle is evident (see figure 17).
Figure 17 Distribution of CH4 emission by activity within top source
sub-sector
Agriculture: Animal Breeding (enteric fermentation)
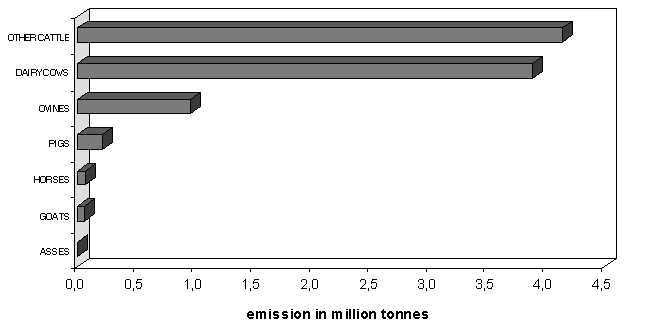
Other Cattle and Dairy Cows are responsible for a significant portion of the European
CH4 emission.
Also important for CH4 emissions are Waste Treatment and Disposal - Land
Filling (CH4 top two) which contribute 17% to the European total.
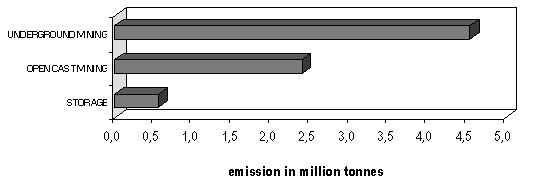
Underground Mining is an important source for the third ranked sub-sector of CH4:
Extraction and 1st Treatment of Solid Fuels (see figure 18). Twelve countries did not
report any emissions from this source. Although there is no active mining in many of these
countries the storage of coal could be an emission source. These emissions are significant
as figure 18 shows. This suggests that Extraction and 1st Treatment of Solid Fuels may be
in fact responsible for larger emissions than estimated in CORINAIR 90.
Figure 18 Distribution of CH4 emission by activity within third top source
sub-sector
Extraction and 1st Treatment of Solid Fuels
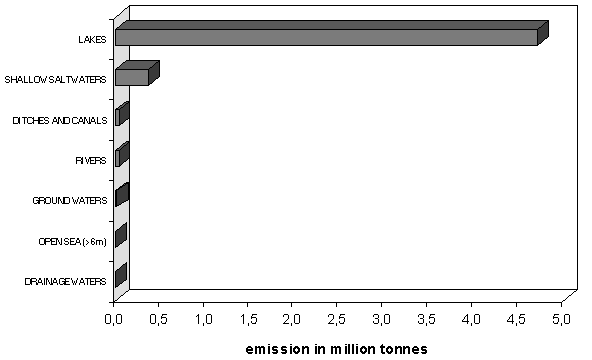
11% of the European total is caused by Nature - Waters, where Lakes are the major
source of CH4 emissions followed by Shallow Saltwater (see figure 19). The
large contribution of Nature - Waters to total CH4 emissions has to be
interpreted with some care, since 83% originate from one country (Greece) and many
countries did not report figures for this source at all (see part II: National Differences
within Europe).
Figure 19 Distribution of CH4 emission by activity within fourth top source
sub-sector
Nature - Waters
Animal Breeding (excretions) is the fifth most important emitter of CH4 with
9% of the European total, with Fattening Pigs followed by Other Cattle and Diary Cows as
the largest sources (see figure 20).
Figure 20 Distribution of CH4 emission by activity within fifth top source
sub-sector
Agriculture - Animal Breeding (excretions)

Nature - Humid Zones is another natural source of CH4 emissions with 6% of
the European total (see figure 21). Again, not all countries reported emissions from this
sub-sector but it is not expected that closing the gaps would result in higher CH4
emissions for Humid Zones compared to the emissions from Animal Breeding (excretion).
Figure 21 Distribution of CH4 emission by activity within sixth top source
sub-sector
Nature - Humid Zones

In general, up until now not so much experience has been gained in preparing emission
inventories for CH4 as e.g. for SO2. This is reflected in the number
of countries reporting for the sub-sectors. Whereas all countries reported for CH4
top one, the ranking for the other sub-sectors is more uncertain because many countries
did not report emissions (gaps). This is especially true for emissions from nature.
Therefore it can be assumed that CH4 emissions of Europe are rather uncertain
in comparison to SOx, CO2 and NOx emissions and are
probably underestimated.
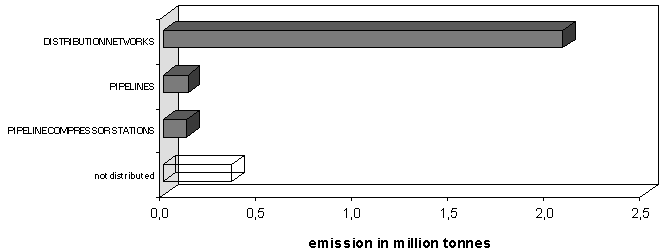
Although Gas Distribution Networks (CH4 top seven) is only responsible for
6%, it is the second largest sub-sector of emissions which is not related to Nature or
Agriculture (see figure 22).
Figure 22 Distribution of CH4 emission by activity within seventh top source
sub-sector
Gas Distribution Networks
NH3
OVERVIEW
93% of the 5,7 million tonnes of NH3 emissions are caused by agricultural
activities (NH3 top one, two and six).
Almost all emissions are produced by the top two sub-sectors (92%). The NH3
top one sub-sector: Animal Breeding (Excretions) is alone responsible for 73% of the total
(see figure 23). In reality, NH3 emissions may not be so exclusively dominated
by these two sub-sectors, since only very few countries reported emissions for the other
sources.
Figure 23 Major source sub-sectors for NH3 in percentage of European total

It is pointed out that Animal Breeding is also the major sub-sector for CH4.
But whereas Enteric Fermentation is more important than Excretions for CH4
emissions it is the other way round for NH3 emissions. However, only two
countries (Czech Republic and Portugal) reported CH4 as well as NH3
figures for both source sub-sectors and the comparison of these figures shows that the
result of any such comparison is highly uncertain.
DISTRIBUTION OF MOST IMPORTANT SOURCE SUB-SECTORS
As for CH4, Diary Cows and Other Cattle are the biggest sub-sectors in
Europe (see figure 24).
Figure 24 Distribution of NH3 emission by activity within top source
sub-sector
Agriculture: Animal Breeding (excretion)

The use of fertilizers is the second biggest source of NH3 emissions being
responsible for 19% of the European total (see figure 25). It is interesting to note that
one country (Greece) contributes more than one third to the total European emissions for
this sub-sector (see part II: National Differences within Europe). Thus the emissions of
this sub-sector might have been overestimated. However this uncertainty would not change
the ranking between the top three NH3 sub-sectors.
Figure 25 Distribution of NH3 emission by activity within second top source
sub-sector
Agriculture - Cultures with Fertilizers
The Inorganic Chemical Industry is the third largest source of NH3 emissions
(see figure 26). The production of NPK (nitrogen, phosphor, potassium) fertilizers is the
biggest source for the NH3 top three emission.
Figure 26 Distribution of NH3 emission by activity within third top source
sub-sector
Production Processes - Inorganic Chemical Industry

Only in recent years have the countries focused on emissions from NH3.
This is reflected in the few number of countries which reported emissions for NH3
top four to top ten. The ranking for these sub-sectors is based mainly on emissions
estimated by Poland, Netherlands, Slovak Republic, Switzerland and the United Kingdom. The
NH3 emissions might therefore have been underestimated and the relative
importance of emissions of the Inorganic Chemical Industry may be less than indicated.
N2O
OVERVIEW
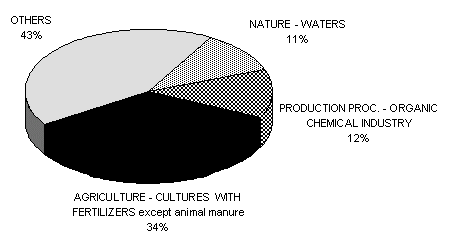
Of the 1,9 million tonnes of N2O emitted in Europe in 1990 Cultures with
Fertilizers are responsible for 34%. This sub-sector is followed by the Organic Chemical
Industry and Nature - Waters (see figure 27). The top three together account for 57%.
Figure 27 Major source sub-sectors for N2O in percentage of European total
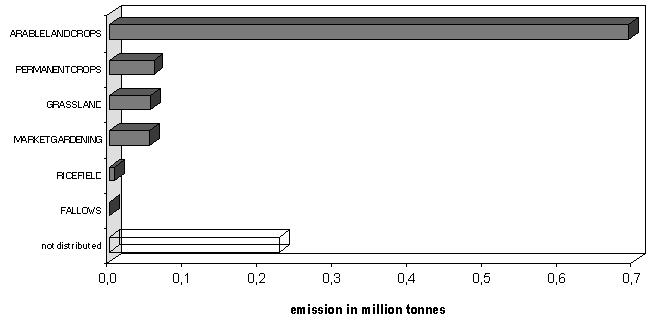
DISTRIBUTION OF MOST IMPORTANT SOURCE SUB-SECTORS
Arable Land and Crops were the major sub-sectors for N2O in Europe in 1990
(see figure 28). The next largest class consists of emissions from countries which did not
differentiate the emissions for this sub-sector category. A comparison with the two other
sub-sectors which are included in agriculture shows that Cultures with Fertilizers clearly
dominate the emissions as compared with emissions from Cultures without Fertilizers and
Natural Grassland.
Figure 28 Distribution of N2O emission by activity within top source
sub-sector
Agriculture: Cultures with Fertilizers (except animal manure)

Production Processes - Organic Chemical Industry are responsible for 12% of
European N2O emissions most of which arise from production of Adipic Acid (see
figure 29). Such emissions have only been reported by six countries.
Figure 29 Distribution of N2O emission by activity within second top source
sub-sector
Production Processes: Organic Chemical Industry

11% of European emissions of N2O is caused by the top three sub-sector
Nature - Waters where the Open Sea is by far the biggest source (see figure 30). Again,
many countries (13) did not report emissions for this source, among them large ones
including the United Kingdom, Germany and Norway. However the large contribution of
Nature-Waters to total N2O emissions has to be interpreted with some care,
since 77% appears to originate from one country (Greece).
Figure 30 Distribution of N2O emission by activity within third top source
sub-sector
Nature: Waters

Natural emissions (N2O top three, four,
seven and nine) have not been reported by all countries. Thus the actual N2O
emissions might be significantly higher than estimated and the ranking might be changed
too since the differences in emissions between top five and top nine are not large.
The production of Nitric Acid is the main source of the N2O top five
sub-sector (see figure 31).
Figure 31 Distribution of N2O emission by activity within fifth top source
sub-sector
Production Processes - Inorganic Chemical Industry

It is interesting to note that unlike emissions for other pollutants (like SO2,
CO, CO2 and NOx) N2O emissions from Production Processes
are significantly larger than N2O emissions from fuel combustion.
NMVOC
OVERVIEW
Only 72% of European NMVOC emissions are covered by the top ten sub-sectors. This is
due to the fact that emissions of organic compounds occur in many sectors and the sources
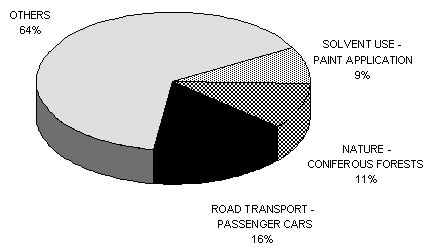
are therefore widespread. The three most important sub-sectors (see figure 32) of the
European total of 22 million tonnes are Road Transport - Passenger Cars (16%), followed by
Nature - Coniferous Forests (11%) and Solvent Use - Paint Applications (9%). The top three
together contributed only 36%.
Figure 32 Major source sub-sectors for NMVOC in percentage of European total
Road transport contributes a large part of the NMVOC total because it includes both
tailpipe emissions (NMVOC top one) and Evaporation Losses (NMVOC top six).
Car driving produces even higher NMVOC emissions since Gasoline Distribution (NMVOC top
ten) is also connected with traffic although, in fact, it belongs to another category
(Extraction and Distribution of Fossil Fuels).
Three of the ten most important NMVOC sub-sectors are solvent related (they represent
20 % of the European total), and thus demonstrate the importance of this source type for
NMVOC.
DISTRIBUTION OF MOST IMPORTANT SOURCE SUB-SECTORS
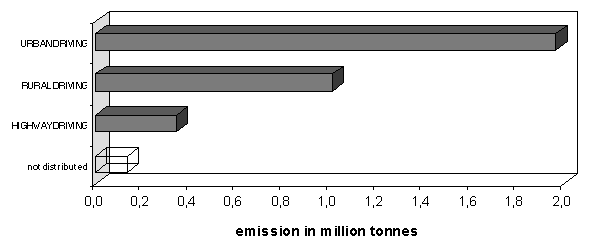
Figure 33 shows that the driving of passenger cars in urban settings contributes much
more to the NMVOC emissions of passenger cars than rural and highway driving. This
contrasts with the NOx emissions of passenger cars where rural traffic is more
important than urban traffic, but is similar to the distribution of CO emissions from
passenger cars (figure 14).
Figure 33 Distribution of NMVOC emission by activity within top source sub-sector
Road transport - Passenger Cars
Coniferous Forests are the second largest source of NMVOC emissions, and, together with
Nature - Deciduous Forests (NMVOC top five), are responsible for almost 20% of the
European total.
Emissions from Solvent Use - Paint Application (NMVOC top three) are dominated by Other
Indus. Application, emissions from the sources Construction and Buildings, Domestic Use
and Manufacture of Automobiles being less important (see figure 34). However this ranking
is not very reliable since many countries did not distinguish between different types of
Solvent Use - Paint Applications.
Figure 34 Distribution of NMVOC emission by activity within third top source sub-sector
Solvent Use - Paint Application

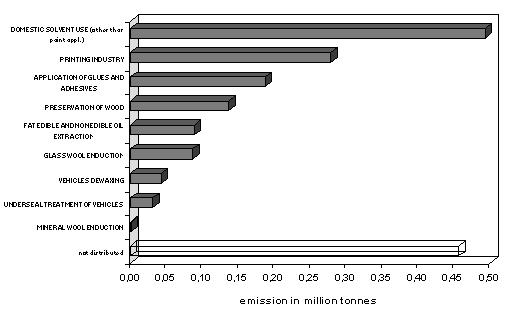
The distribution of NMVOC top four Solvent Use - Other Use of Solvents and Related
Activities (see figure 35) is dominated by Domestic Solvent Use, followed by the Printing
Industry and several other industrial activities. Again, the distribution presented is not
a very vigorous one, as many countries did not estimate individual emissions for the
various sources of the NMVOC top four sub-sector.
Figure 35 Distribution of NMVOC emission by activity within fourth source sub-sector
Solvent Use - Other Use of Solvents and Related Activities


Document Actions
Share with others