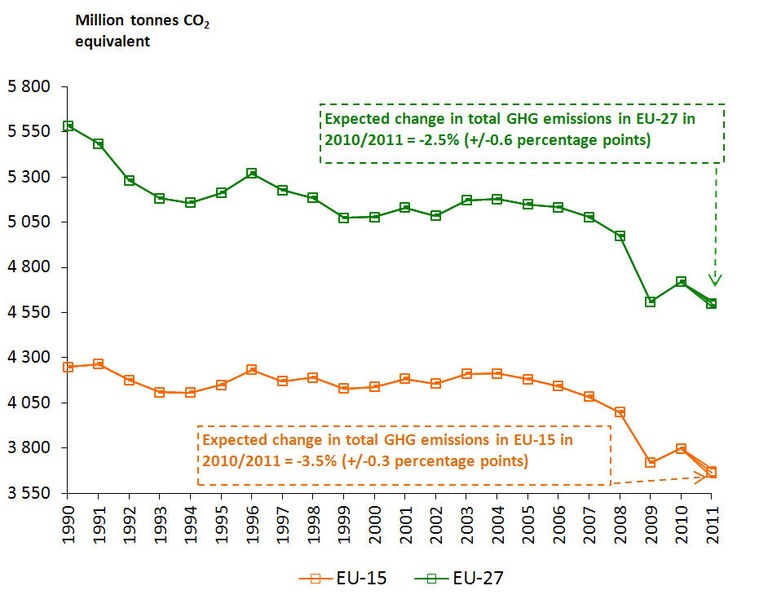
Emissions fell even further in the 15 Member States with a common commitment under the Kyoto Protocol (EU-15), going down by 3.5 % between 2010 and 2011. Based on these EEA estimates, EU 2011 emissions stand approximately 17.5 % below the 1990 level. The EU-15 stands 14.1 % below the base-year level under the Kyoto Protocol.
The main reasons for the decrease in emissions were a milder winter in most parts of the EU, which resulted in lower heating demand from households, and reduced natural gas consumption. Renewable energy consumption also continued to increase in 2011, which contributed to the observed decrease in emissions.
The economic sectors not covered by the EU Emission Trading System (EU ETS) reduced emissions by approximately 3.1 %. The sectors contributing most to lower emissions in the European Union in 2011 were households and the service sector. The transport sector also contributed by reducing emissions for the fourth consecutive year. Emissions under the EU ETS were cut by 1.8 % in 2011.
Figure – European Union Greenhouse Gas Emissions (1990-2010 and estimate for 2011)

The EEA's early greenhouse gas emission estimates
- The EEA estimates of EU's total 2011 greenhouse gas emissions are based on publicly available verified EU-ETS emissions, and other national and European sources, available as of mid-July 2012.
- The EEA estimates exclude data for carbon sinks, international aviation and shipping as well as emission reductions achieved through the Kyoto Protocol's flexible mechanisms. These data will be made available with EEA's Greenhouse Gas Inventory 2011, to be published in June 2013.
- The uncertainty in the current emissions estimates is 2.5 % (+/-0.3 percentage points) for EU-27, and -3.5 % (+/-0.64 percentage points) for the EU 15.
What next?
- Details of EEA and Member State emission estimates for 2011 will be published in an EEA Technical Report on the approximated EU greenhouse gas inventory in October 2012.
- The 2011 estimates will feed into the EEA report on greenhouse gas emission trends and projections in Europe. The report will track progress towards the European Union's greenhouse gas mitigation targets under the Kyoto Protocol and up to 2020.
- The official 2011 greenhouse gas emissions for the EU will be available by mid-2013, published as the 'EU Greenhouse Gas Inventory 1990–2011 and Inventory Report 2013', compiled and quality-checked by the EEA. This EEA report will be subsequently submitted to the United Nations Framework Convention on Climate Change (UNFCCC) by the European Commission on behalf of the European Union.
More information

Document Actions
Share with others