NEWS RELEASE
Copenhagen, 6 May 2003
For immediate release
EU greenhouse gas emissions rise for second year
running
Greenhouse gas (GHG) emissions from the European Union have
increased for the second consecutive year, moving the EU further away
from meeting its commitment to achieve a substantial emissions cut by
the 2008-2012 period.
Total EU emissions of six gases widely considered to be contributing
to global climate change are estimated to have stood 1.0% higher in
2001, the latest year for which data are available, than a year
earlier, the annual emissions inventory compiled by the European
Environment Agency shows.
A preliminary assessment indicates that the main reasons for the
rise were a colder winter in most EU countries that led households to
burn more heating fuel, higher emissions from transport and greater use
of fossil fuels in electricity and heat production.
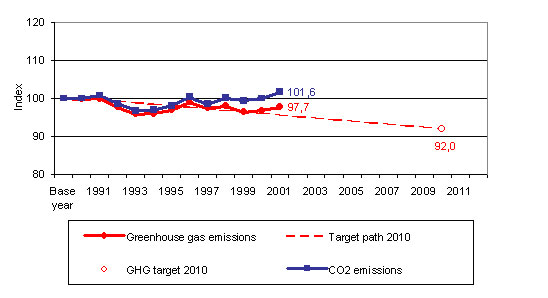
Despite the increase from 2000, EU GHG emissions in 2001 stood 2.3%
below their level in 1990. However, this was less of a drop than in the
two previous years. In 2000 emissions had stood 3.3% lower than in 1990
and in 1999, 3.6% lower.
The EU must bring down its emissions of the six gases to 8% below
their 1990 level by 2008-2012 if it is to comply with the Kyoto
Protocol on combatting climate change.
The inventory represents best estimates and is subject to annual
revision. It does not take account of the impact of land use and
forestry, which can either produce emissions or absorb them, because no
internationally accepted methodologies exist yet.
EU emissions of carbon dioxide (CO2), by far the most important
greenhouse gas, accounting for 82 % of total EU GHG emissions,
increased by 1.6% between 2000 and 2001. They also stood 1.6% higher in
2001 than in 1990. Revised figures show that the EU held its CO2
emissions in 2000 at their 1990 level, as it had committed itself to
do. Initial data had indicated that CO2 emissions in 2000 were 0.5%
lower than in 1990.
Increased heating needs meant that CO2 emissions from households and
small businesses jumped 6.0% in 2001 from a year earlier, contributing
substantially to the increase in overall GHG emissions. Germany, France
and the United Kingdom saw the biggest rises in CO2 emissions from
households and small businesses. CO2 emissions from electricity and
heat production rose by 1.5% between 2000 and 2001, and those from
transport by 1.3%. The main reasons for these increases are growing
production of power and heat from fossil fuels, in particular coal, and
a continuing increase in transport volumes, especially in road
transport.
The latest figures show that 10 of the 15 Member States are heading
towards overshooting their agreed share of the EU GHG emissions target
by a wide margin. This is the case for Austria, Belgium, Denmark,
Finland, Greece, Ireland, Italy, the Netherlands, Portugal and
Spain.
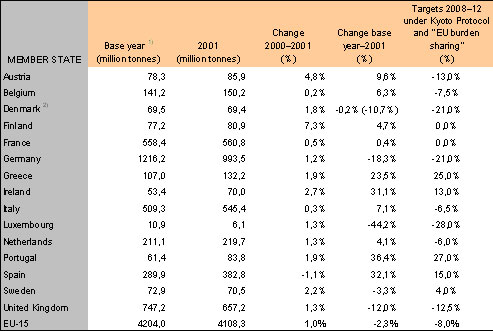
Big increases in emissions from 2000 to 2001 occurred in Austria
(+4.8%) and Finland (+7.3%). Initial analysis indicates these were
partly due to the cold winter but also to lower rainfall which cut
hydropower production in both countries and reduced Finland's imports
through the Nordic electricity market. Consequently Austria and Finland
had to increase their use of fossil fuels for power and heat
production.
Ireland, Spain and Portugal are furthest away from keeping to their
share of the EU target. Ireland's emissions in 2001 stood 31% higher
than in 1990, well over double the 13% increase it is allowed between
1990 and 2008- 2012.
For the first time in five years Spain's emissions decreased, by
1.1% compared with 2000, due to higher hydropower production which
reduced use of fossil fuels for power and heat.
Luxembourg shows the biggest GHG emissions cut of any Member State
in percentage terms, decreasing by 44% since 1990. Germany, the largest
EU emitter, has achieved the deepest reduction among the big Member
States, with a 18% cut since 1990. Between 2000 and 2001 Germany's
emissions rose by 1.2%, however.
Details of EU and Member State emissions are shown in the Annex to
this news release. EEA will publish an analysis of the emission figures
and trends, together with latest projections for the year 2010, in
autumn 2003.
The inventory is available on the EEA's web site at http://reports.eea.europa.eu/technical_report_2003_95/en
Notes to editors
- The 1997 Kyoto Protocol to the UN Framework Convention on Climate
Change (UNFCCC) will control industrialised countries' emissions of
CO2, methane (CH4) and nitrous oxide (N2O), plus three fluorinated
industrial gases: hydrofluorocarbons (HFCs), perfluorocarbons (PFCs)
and sulphur hexafluoride (SF6). The EU is responsible for around 24% of
industrialised countries' man-made emissions of the six gases. The
Protocol has yet to achieve the required number of ratifications to
enter into force.
- A "burden-sharing" agreement between EU governments lays down
differentiated emissions limits for each Member State with the aim of
ensuring that the EU meets its overall 8% reduction commitment under
the Protocol. The limits are expressed in terms of percentages by which
Member States must reduce, or in some cases may maintain or increase,
their emissions compared with the base year level. The national
commitments are shown in Table 1 in the Annex. For the sake of
simplicity, in this press release 1990 is treated as the base year for
all gases. In fact, the inventory uses 1995 as the base year for the
three fluorinated gases, as allowed for under the Protocol. This
reflects the preference of most Member States.
- The EEA and its Topic Centre on Air and Climate Change compiles and
quality-checks the annual inventory for the European Commission from
data provided by Member States. The Commission has submitted it to the
Secretariat of the UNFCCC. The inventory is published as EEA Technical
Report No 95 and titled Annual European Community Greenhouse Gas
Inventory 1990-2001 and Inventory Report 2003. Submission to the
Secretariat of the UNFCCC.
- Figures for 2000 and previous years have been revised because of
recalculations by Member States using improved methodologies for
estimating emissions and/or improved data on economic activity. The
fall in total EU GHG emissions between 1990 and 2000 has been revised
to 3.3% from 3.5% in last year's inventory.
About the EEA The European Environment Agency is
the main source of information used by the European Union and its
Member States in developing environment policies. The Agency aims to
support sustainable development and to help achieve significant and
measurable improvement in Europe's environment through the provision of
timely, targeted, relevant and reliable information to policy-making
agents and the public. Established by the EU in 1990 and operational in
Copenhagen since 1994, the EEA is the hub of the European environment
information and observation network (Eionet), a network of around 300
bodies across Europe through which it both collects and disseminates
environment-related data and information.
The Agency, which is open to all nations that share its objectives,
currently has 31 member countries. These are the 15 EU Member States;
Iceland, Norway and Liechtenstein, which are members of the European
Economic Area; and the 13 EU accession and candidate countries, namely
Bulgaria, Cyprus, the Czech Republic, Estonia, Hungary, Latvia,
Lithuania, Malta, Poland, Romania, Slovenia, the Slovak Republic and
Turkey. The EEA is the first EU body to take in the accession
countries. Negotiations on EEA membership are also under way with
Switzerland.
Annex The following figures and tables give
details, for each Member State and the EU as a whole, of trends in
emissions of the six greenhouse gases up to 2001. Emissions from
international aviation and shipping, and emissions from/removals by
land use change and forestry, are not covered.
Figure 1: Total EU greenhouse gas emissions in relation to
the Kyoto target

Table 1: Greenhouse gas emission trends and Kyoto Protocol
targets for 2008-2012

1) Base year for CO2, CH4 and N2O is 1990; for
fluorinated gases 1995 is used as the base year, as allowed for under
the Kyoto Protocol. This reflects the preference of most Member
States.
2) For Denmark, data that reflect adjustments in 1990 for
electricity trade (import and export) and for temperature variations
are given in brackets. This methodology is used by Denmark to monitor
progress towards its national target under the EU "burden sharing"
agreement. For the EU emissions total non-adjusted Danish data have
been used.
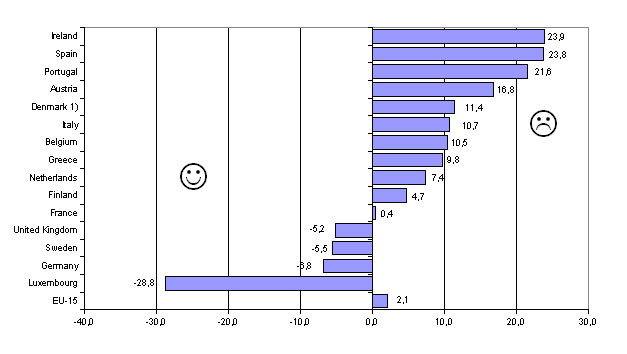
Figure 2: Distance-to-target (DTI) for EU Member States in
2001 (Kyoto Protocol and EU burden sharing targets)

1) The Danish DTI is +0,9 if Danish greenhouse gas
emissions in the base year are adjusted for electricity trade (import
and export) and for temperature variations.
The distance-to-target indicator (DTI) is a measure of the deviation
of actual greenhouse gas emissions in 2001 from the linear target path
between 1990 and the Kyoto Protocol target for 2008-2012, assuming that
only domestic measures will be used (see Figure 2). For example,
Ireland is allowed a 13% increase from 1990 levels by 2008-2012, so its
theoretical "linear target" for 2001 is a rise of no more than 7,2%.
Its actual emissions in 2001 show an increase of 31,1% since 1990,
hence its "distance to target" is 31,1-7,2, or 23,9 index points.
Germany's Kyoto target is a 21% reduction, so its theoretical "linear
target" for 2001 is a decrease of 11,5%. Actual emissions in 2000 were
18,3% lower than in 1990, hence its distance to target is 18,3-11,5, or
6,8 index points.
The EEA's evaluation of progress up to 2001 is reflected in
"smileys" according to the distance-to-target indicator in 2001. The
following rating system is used:
 Positive
contribution to EU trend: the negative distance-to-target indicator
means that the Member State is below its linear target path
 Negative
contribution to EU trend: the positive distance-to-target indicator
means that the Member State is above its linear target path


 Positive
contribution to EU trend: the negative distance-to-target indicator
means that the Member State is below its linear target path
 Negative
contribution to EU trend: the positive distance-to-target indicator
means that the Member State is above its linear target path
Document Actions
Share with others