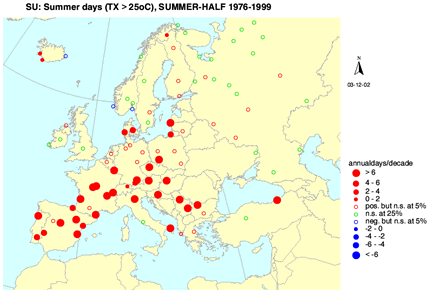
 Figure 1: Trend in summer days in Europe
Source: ECA, 2002 (KNMI)
Note:
Changes in number of summer days per year, for the period 1976-1999
Summer days are days at which the maximum temperature is above 25 °C. The map shows the increase in the number of
summer days per year, in the last 25 years, and is expressed in number of days per decade. Clearly, large parts of
Europe experienced an increase of more than 6 days in the number of summer days (hence, and increase of 15 or more
days since 1976). Regions that have relatively many days per year near 25 °C maximum temperature have largest sensitivity
for changes; other regions are less sensitive. This explains why e.g. northern Scandinavia show little increase in
the number of summerdays (most often, maximum temperatures are well below 25 °C).
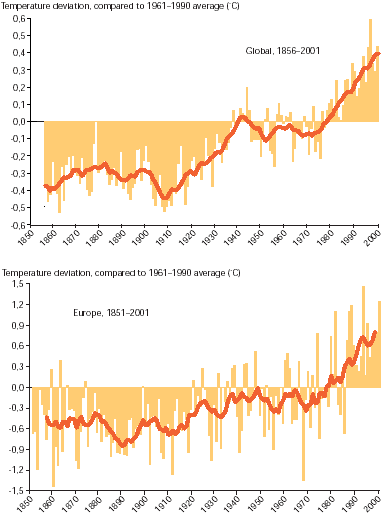
 Figure 2: Observed annual average temperature deviations (global and European)
Source: Climatic Research Centre (CRU)
Note: The bars show the annual average and the line the 10-year smoothed trend. Europe
includes Siberia.
Over the past 100 years European (including Siberia) mean temperature has increased by about 1.2 °C and the 1990s was the
warmest decade over the past 150 years. There is increased evidence that most of this warming can
be attributed to the emission of greenhouse gases from human activities. The flooding in central
Europe in 2002 can be considered an example of what may happen if climate change continues.
Global precipitation increased by about 2 % during the last century, with northern Europe and the
western part of the Russian Federation getting 1040 % wetter with a further projected increase
of 12 % per decade. In southern Europe and most of the countries of eastern Europe precipitation
in summer is projected to decrease by up to 5 % per decade, while the winters may become wetter.
Read more about the causes, the possible consequences, and the national and international
activities under the Kyoto protocol to limit climate change in EEA's report "Europe's environment
- The Third Assessment", chapter 3: climate change.
Other sources from EEA for more information on heatwaves, floods and droughts:
Other sources for information on temperature changes
Several institutions are involved in the monitoring and assessment of
temperature change and can supply more detailed information on specific areas.
Current European (UK) heatwave
Global climate change
European climate change
Example of climate change in a country (UK)
Read more
 Figure 1: Trend in summer days in Europe
Document Actions
Share with others