3. NON-METHANE
VOLATILE ORGANIC COMPOUNDS - NMVOC
3.1 NMVOC-emissions by countries
The 1990 annual total NMVOC-emissions for EUROPE
were estimated to be 22 million tonnes. These emissions broken down by EU-12, EFTA-5 and
PHARE-10 countries are shown in figure 3.1. The largest contributor were the EU-12
countries with 69%, second largest the PHARE-10 countries with 16%. The EFTA-5 countries
contributed 11% and Germany (former East) and Malta 4%.
Figure 3.1: Contribution in % to the EUROPEAN total
NMVOC-emissions

*) Croatia not yet available
Figure 3.2 shows the relative contribution of
individual countries to the total of 20 million tonnes. In 1990 the largest contributing
countries were France (13%), United Kingdom (12%), Germany (former West 11%) and Italy
(12%); the smallest contributing countries were Malta (0.02%), Luxembourg (0.09%) and
Slovenia (0.2%). These differences are due to different size of population, different per
capita emissions (see also paragraph 3.3)
and differences in emissions from natural sources.
Figure 3.2: Contribution in % of each country to the
EUROPEAN total NMVOC-emissions

*) Croatia not yet available
3.2 NMVOC-emissions per group
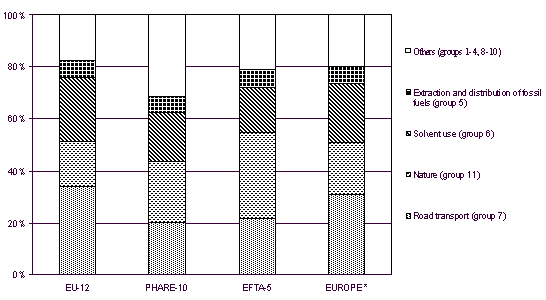
One third of the NMVOC-emissions for EUROPE resulted
from emissions of group 7 (road transport) and from group 8 (other mobile sources and
machinery). Group 6 (solvent use) and group 11 (nature) each contributed about 20% and
group 4 (production processes) and group 5 (extraction and distribution of fossil fuels)
each contributed 6%. In contrast to other pollutants group 1 (public power, cogeneration
and district heating), 2 (commercial, institutional and residential combustion) and 3
(industrial combustion) together produced little of the NMVOC-emissions with only 6%. The
remaining 5% of the total emissions can be attributed almost exclusively to emissions of
the groups 9 (waste treatment and disposal) and 10 (agriculture).
The split of the NMVOC-emissions into groups for
EU-12, EFTA-5 and PHARE-10 countries is quite similar compared to the split for EUROPE
with the exception of the larger contribution of group 2 (commercial, institutional and
residential combustion) with 10% and of group 11 (nature) with 33% to the total
NMVOC-emissions for the EFTA-5 countries (see figure 3.3).
The differences of contributions especially of
source groups 2, 6, 7 and 11 to the total emissions are larger between countries than
these groups (see also table 3.1). The relative contribution of the NMVOC-emissions of
group 2 ranges from 20% (Czech Republic) to 0% (Finland, Greece, Malta, Luxembourg), of
group 7 from 59% (Malta) to 10% (Romania), of group 6 (solvent use) from 47% (Switzerland)
to 1% (Latvia), and of group 11 from 68% (Portugal) to 0% (Estonia, Hungary, Malta,
Norway, Slovenia, Switzerland).
However it is evident from these differences in the
relative contribution of sourcegroups to a countries total emission that strategies for
reduction of NMVOC-emissions need individual solutions as well as common elements.
Figure 3.3: Contribution in % of source groups to
the EUROPEAN NMVOC-emissions

*) Croatia not yet available
3.3
NMVOC-emissions per capita
Only anthropogenic emissions are expected to be
related to population for these calculations. Therefore group 11 (nature) has been
excluded.
For EUROPE the average NMVOC-emissions per capita
were as 36 kg/capita. Compared to this number the per capita NMVOC-emissions were almost
equal (+6%) for the EU-12 countries with 38 kg/capita, 39% larger for the EFTA-5 countries
with 50 kg/capita and 31% smaller for the PHARE-10 countries with 25 kg/capita. This
comparison is also shown in figure 3.4 and table 9.
Again the differences are much larger if individual
countries are compared; the largest NMVOC-emissions per capita were estimated for Norway
(64 kg/capita) and the next largest ones for Austria (55 kg/capita) and Sweden (53
kg/capita); the smallest per capita emissions for NMVOC were calculated for Malta (13
kg/capita), Hungary (14 kg/capita), Slovenia and Latvia (each 18 kg/capita) and Portugal
(20 kg/capita). Figure 3.5 shows the countries ranked according their per capita
emissions. The already mentioned special report for NMVOC will analyse these large
differences in the per capita emissions for NMVOC; the smallest per capita emissions being
a factor of 5 smaller compared to the largest number.
Figure 3.4: NMVOC-emissions per capita for EUROPE

*) Croatia not yet available
Figure 3.5: NMVOC-emissions per capita for
individual countries

*) Croatia not yet available
3.4 NMVOC-emissions per km2
The emissions per km2 have been
calculated from the total emissions, the emissions of group 11 (nature) having been
included in this case.
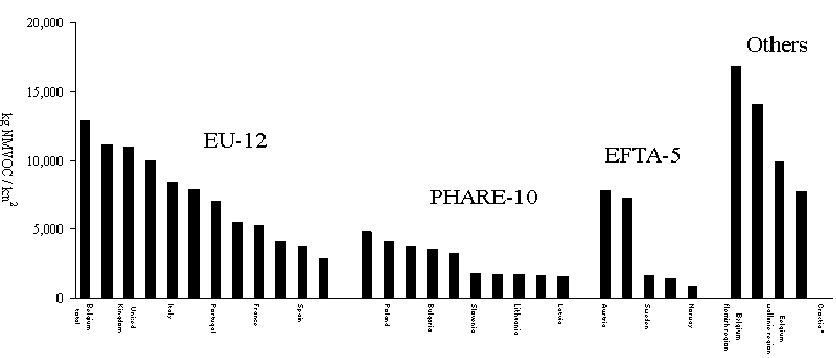
For EUROPE the average NMVOC-emissions per km2
were estimated as 4 603 kg/km2. Compared to this number the per km2
NMVOC-emissions were 45% larger for the EU-12 countries with 6 676 kg/km2, 30%
smaller for the PHARE-10 countries with 3 221 kg/km2 and 58% smaller for the
EFTA-5 countries with 1 941 kg/km2. This comparison is also shown in figure 3.6
and table 10.
Figure 3.6: NMVOC-emissions per km2 for
EUROPE

*) Croatia not yet available
Again the differences are much larger if individual
countries are compared; the largest NMVOC-emissions per km2 were for Belgium,
Flemish region (16 871 kg/km2), Malta (14 101 kg/km2) and the next
largest ones for the Netherlands (11 094 kg/km2) and the United Kingdom (10 986
kg/km2); the smallest emissions per km2 for NMVOC were for Norway
(833 kg/km2), Finland (1 353 kg/km2) and Latvia (1 549 kg/km2).
Figure 3.7 shows the countries ranked according their NMVOC-emission per km2.
The differences in the emissions per km2 between countries are much larger
compared to the per capita emissions. The smallest number being 20 times smaller than the
largest number.
Figure 3.7: NMVOC-emissions per km2 for
individual countries

*) Croatia not yet available
Table 3.1: Non-Methane
Volatile Organic Compounds emissions per country and group


Document Actions
Share with others