NEWS RELEASE Copenhagen,
20 April 2001
EU greenhouse gas emissions down 4%, more cuts needed
- EEA
The 15 European Union countries recorded a 4.0%
reduction between 1990 and 1999 in their combined emissions of the six
"greenhouse" gases covered by the Kyoto Protocol on climate change,
according to the latest emissions inventory produced by the European
Environment Agency.
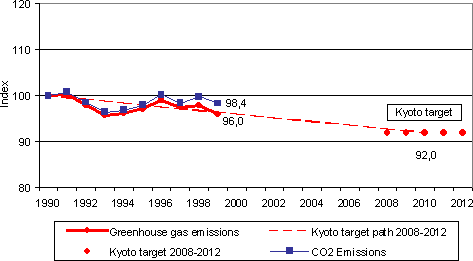
The cut takes the EU half way towards achieving the
Kyoto target of reducing its emissions of these gases to 8% below their
1990 level by the years 2008-2012. The EU is responsible for 24% of
industrialised countries' man-made emissions of the six gases.[1]
The EU reduction contrasts with an 11% increase in
greenhouse gas emissions over the same period in the United States,
which accounts for 40% of the industrialised world's man-made
emissions.[1],[2]
The EU's progress was helped by a 2.0% fall in
greenhouse gas emissions in 1999, which came despite economic
growth[3] of
2.5%. The emissions drop was due to a combination of favourable
factors, some of which will not be repeated, however.[4]
The annual inventory for 1990-1999 also shows that
the EU remains on track to meet its commitment to stabilise emissions
of carbon dioxide (CO2), the most important greenhouse gas, at 1990's
level by the year 2000.
In 1999, the latest year for which data are
available for all member countries, the EU's CO2 emissions were 1.6%
lower than in 1990. They fell by 1.4% between 1998 and 1999.
CO2 accounts for around 80% of the EU's total
greenhouse gas emissions.
Despite these positive trends the EEA sees no room
for complacency and warns that further major efforts to reduce
emissions are needed to achieve the Kyoto targets.
The favourable picture to date has been determined
largely by considerable emissions falls in Germany and the United
Kingdom, the EU's two biggest emitters, together contributing around
40% of total EU greenhouse gas emissions.
These emissions reductions - 18.7% in the case of
Germany and 14.0% for the UK - are mainly the result of lower coal
consumption due to a shift towards increased use of gas in power
generation in both countries[5], the closure of
industrial plant in eastern Germany following German unification and
improvements in Germany's energy efficiency.
However, this situation could rapidly change.
Initial preliminary estimates indicate that in 2000 the UK's
CO2 emissions increased by 2% and Germany's
energy-related CO2 emissions rose by 0.2%
from their respective 1999 levels.[6] In both cases,
increased use of coal has been identified as the main cause.
Moreover, on present trends, more than half of the
other Member States are headed towards substantially exceeding their
agreed share of the EU's total allowed emissions under the Kyoto
Protocol.[7]
This is the case for Austria, Belgium, Denmark, Greece, Ireland, Italy,
the Netherlands, Portugal and Spain.
The 1997 Kyoto agreement, which the EU hopes will
receive enough ratifications to enter into force next year,[8] covers emissions of
CO2, methane (CH4)
and nitrous oxide (N2O), plus the three
fluorinated gases hydrofluorocarbons (HFCs), perfluorocarbons (PFCs)
and sulphur hexafluoride (SF6). Following
substantial improvements in Member States' reporting of emissions of
the fluorinated gases, the latest inventory[9] includes EU totals
for all six Kyoto gases for the first time.
The inventory was compiled and quality-checked for
the European Commission by the EEA and its Topic Centre on air and
climate change on the basis of national data generated using
measurement and modelling methodologies developed by the UN's
Intergovernmental Panel on Climate Change (IPCC)[10].
The inventory includes emissions of the six gases
from all sources, with the exception of emissions from international
aviation and marine transport and emissions from, and removals by, land
use change and forestry. No internationally accepted methodologies
exist yet for monitoring these sources and sinks.
For 1999 all Member States were able to supply data
except Belgium and Luxembourg, for which emissions estimates have been
used.
The
inventory will be published on the EEA's web site.
Details of the emissions trends for the EU and each
Member State are shown in the annex to this news release.
Notes to Editors
[1]Excluding emissions from and removals by land
use change and forestry.
[2]For
further information see the web site of the UN Framework Convention on
Climate Change (http://www.unfccc.de/resource/ghg/tempemis2.html).
[3]Measured in terms of Gross Domestic Product
(GDP).
[4]The
main reasons were the one-off introduction of technical measures to
reduce N2O emissions at adipic and nitric
acid production plants in France and the UK and HFC emissions from the
UK HFC industry; a continuation of the shift from coal to gas seen
during the 1990s, particularly in Germany and the UK; and relatively
mild winters in Germany, UK, France and the Netherlands which reduced
energy use for indoor heating.
[5]Shifting from coal to natural gas reduces
CO2 emissions because of the lower carbon
content of natural gas and the overall higher energy efficiency of
gas-fired power plants.
- [6]Sources:
- UK Department of Trade and Industry. See
- http://www.dti.gov.uk/EPA/bpmar2001.pdf
and
- http://www.press.detr.gov.uk/0103/ae-99.htm#pdf).
- DIW economic research institute
(Germany).
[7]The
burden-sharing" agreement reached by EU environment ministers in June
1998 lays down differentiated emissions limits for each Member State
with the aim of ensuring that the EU meets its overall 8% reduction
commitment under the Protocol. The limits are usually expressed in
terms of percentages by which Member States must reduce, or in some
cases may hold or increase, their emissions from the base year level.
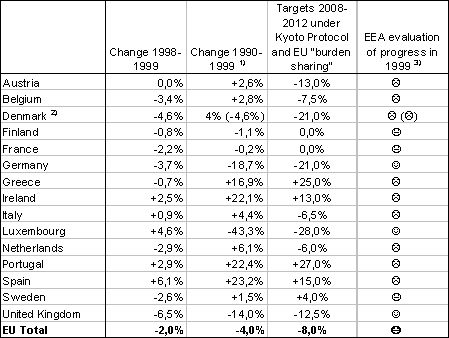
The national targets are given in Table 1 in the Annex.
[8]To
enter into force, the Protocol requires ratification by at least 55
Parties to the UN Framework Convention on Climate Change, including
countries responsible for at least 55% of the industrialised world's
total CO2 emissions in 1990. The EU and its
Member States have stated their intention to ratify the Protocol by
2002.
[9]The
inventory was submitted by the European Commission to the Secretariat
of the UN Framework Convention on Climate Change on 11 April 2001. It
is published as EEA Technical
Report No 60 and titled Annual European Community Greenhouse Gas
Inventory 1990-1999. Submission to the Secretariat of the UNFCCC. A
more thorough analysis of the EU emission trends will be finalised by
the EEA and its Topic Centre on air and climate change in July 2001 and
also published on the EEA web site.
[10]The
IPCC brings together hundreds of experts from across the world to
assess the scientific, technical and socio-economic information
relevant for understanding the risk of human-induced climate change.
Web site: http://www.ipcc-nggip.iges.or.jp.
About the EEA
The European Environment Agency aims to support
sustainable development and to help achieve significant and measurable
improvement in Europe's environment through the provision of timely,
targeted, relevant and reliable information to policy making agents and
the public. Established by the European Union (EU) in 1990 by Council
Regulation 1210/90 (subsequently amended by Council Regulation
933/1999), the Agency is the hub of the European Environment
Information and Observation Network (EIONET), a network of some 600
environmental bodies and institutes across Europe.
Located in Copenhagen and operational since 1994,
the EEA is open to all countries that share its objectives and are able
to participate in its activities. It currently has 18 member countries
- the 15 EU Member States, plus Iceland, Norway and Liechtenstein,
which are members of the European Free Trade Association (EFTA). The 13
countries in central and eastern Europe and the Mediterranean area that
are seeking accession to the EU are expected to join the EEA in the
coming months, making the Agency the first EU body to welcome these
countries.
Annex
The following figure and tables give details,
for each Member State and the EU overall, of trends in emissions of all
greenhouse gases and CO2, excluding emissions
from and removals by land use change and forestry, up to an including
1999.
Figure 1: Total EU greenhouse gas emissions
in relation to the Kyoto target

Table 1: Greenhouse gas emission trends and
Kyoto Protocol targets for 2008-2012

1) For the fluorinated gases some Member
States have selected a base year other than 1990, as allowed for under
the Protocol.
2) For Denmark, data that reflect adjustments for
electricity trade (import and export) in 1990 are given in brackets.
This methodology is used by Denmark to monitor progress towards its
national target under the EU "burden sharing” agreement. For the EU
emissions total the non-adjusted Danish data have been used.
3) The EEA's evaluation of progress to 1999 awards "smileys”
if the trend from the base year to 1999 is in line with a linear target
path in 1999. The following rating system is used:
 more than 2 index points below linear target path
(positive contribution to EU trend)
 more than 2 index
points above linear target path (negative contribution to EU
trend)
 in a range of
plus/minus 2 index points of linear target path (some positive
contribution to EU trend)
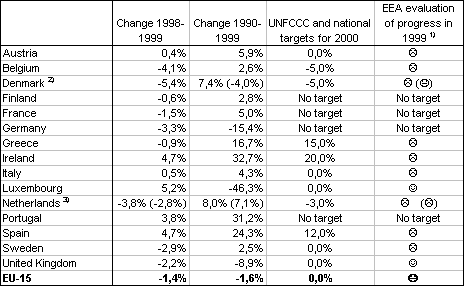
Table 2: CO2
emissions and targets for 2000

1) See note 3 in Table 1.
2) See note 2 in Table 1.
3) For the Netherlands, data that reflect adjustments for
temperature variations in 1990-1999 are given in brackets. The Dutch
national target takes these adjustments into account.


Document Actions
Share with others