Key messages
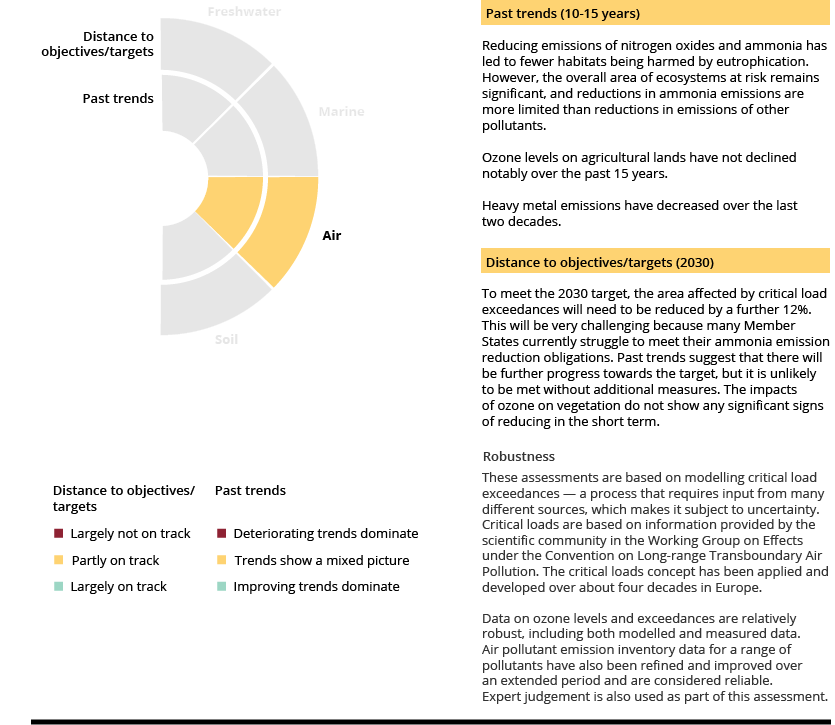
- Between 2005 and 2020, the area of habitats affected by air pollution decreased by 12% — moving towards the zero pollution target of achieving a 25% reduction by 2030. However, the rate of progress so far indicates that the target will not be met. This would leave over 70% of habitats at risk of eutrophication.
- Acidification is now less of a concern than it was, primarily as a result of measures that have successfully reduced sulphur — and, to some extent, nitrogen — emissions.
- The impact of ground-level ozone on crop production varies significantly each year. Despite decreases in emissions of ‘precursor’ pollutants (which react to form ozone in the atmosphere after their release), there are not yet any signs of significant decreases in ozone levels.

Guidance for interpreting the summary
The infographic above summarises the overall findings on air pollution. Two distinct elements are considered:
- whether the past trend in pollution is positive, negative or uncertain
- the current 'distance to target', based on an assessment of the current trends or status and whether or not the EU is on track to achieve the defined zero pollution targets for 2030 and/or other relevant policy targets.
The analysis is based on a combination of (1) available indicators and data, as presented below, and (2) expert judgement.
Introduction
Airborne pollutants are transported in the atmosphere. When these pollutants are deposited on land or water, they can harm ecosystems and habitats. For example, the global mercury cycle results in the ongoing long-range transport of mercury; this negatively affects both terrestrial and marine species (EEA, 2018a).
Key pollutants that potentially harm ecosystems include nitrogen, ground-level ozone, sulphur dioxide (SO2) and heavy metals. These pollutants are controlled through EU actions under a range of different mechanisms, including the EU’s National Emission Reduction Commitments (NEC) Directive and Air Quality Directive, and the EU’s commitments and related legislative measures aimed at supporting the United Nation’s Convention on Long Range Transboundary Air Pollution. Information on EU emissions of these pollutants is available through the EEA’s air pollutant emissions data viewer (EEA, 2021a).
Trends in nitrogen and sulphur deposition and their impacts
Eutrophication
The atmospheric deposition of nitrogen in terrestrial ecosystems can result in harmful eutrophication effects in terrestrial, freshwater and marine habitats. This happens when so-called critical loads are exceeded; that is, when the amount of nitrogen deposited exceeds a threshold above which significant impacts may occur. Excess amounts of nitrogen disrupt terrestrial and aquatic ecosystems and lead to changes in species diversity.
One of the key pollutants closely associated with the exceedance of critical loads is ammonia (NH3), primarily released from the agricultural sector, which is responsible for 94% of the EU’s NH3 emissions. From 2005 to 2020, EU-27 emissions of NH3 fell by only 8% (Figure 10) while reductions in emissions of all other pollutants were much more significant, as explained in the zero pollution cross-cutting story on the National Emissions reduction Commitments Directive (NEC). The main economic activity contributing to emissions of nitrogen oxides (NOX) (the second main pollutant contributing to eutrophication) is transport (accounting for 43% of emissions in 2020).
Notes: NH3 = ammonia. NOx = nitrogen oxides. SO2 = sulphur dioxide.
Source: EEA (2021).
Click here for different chart formats and data
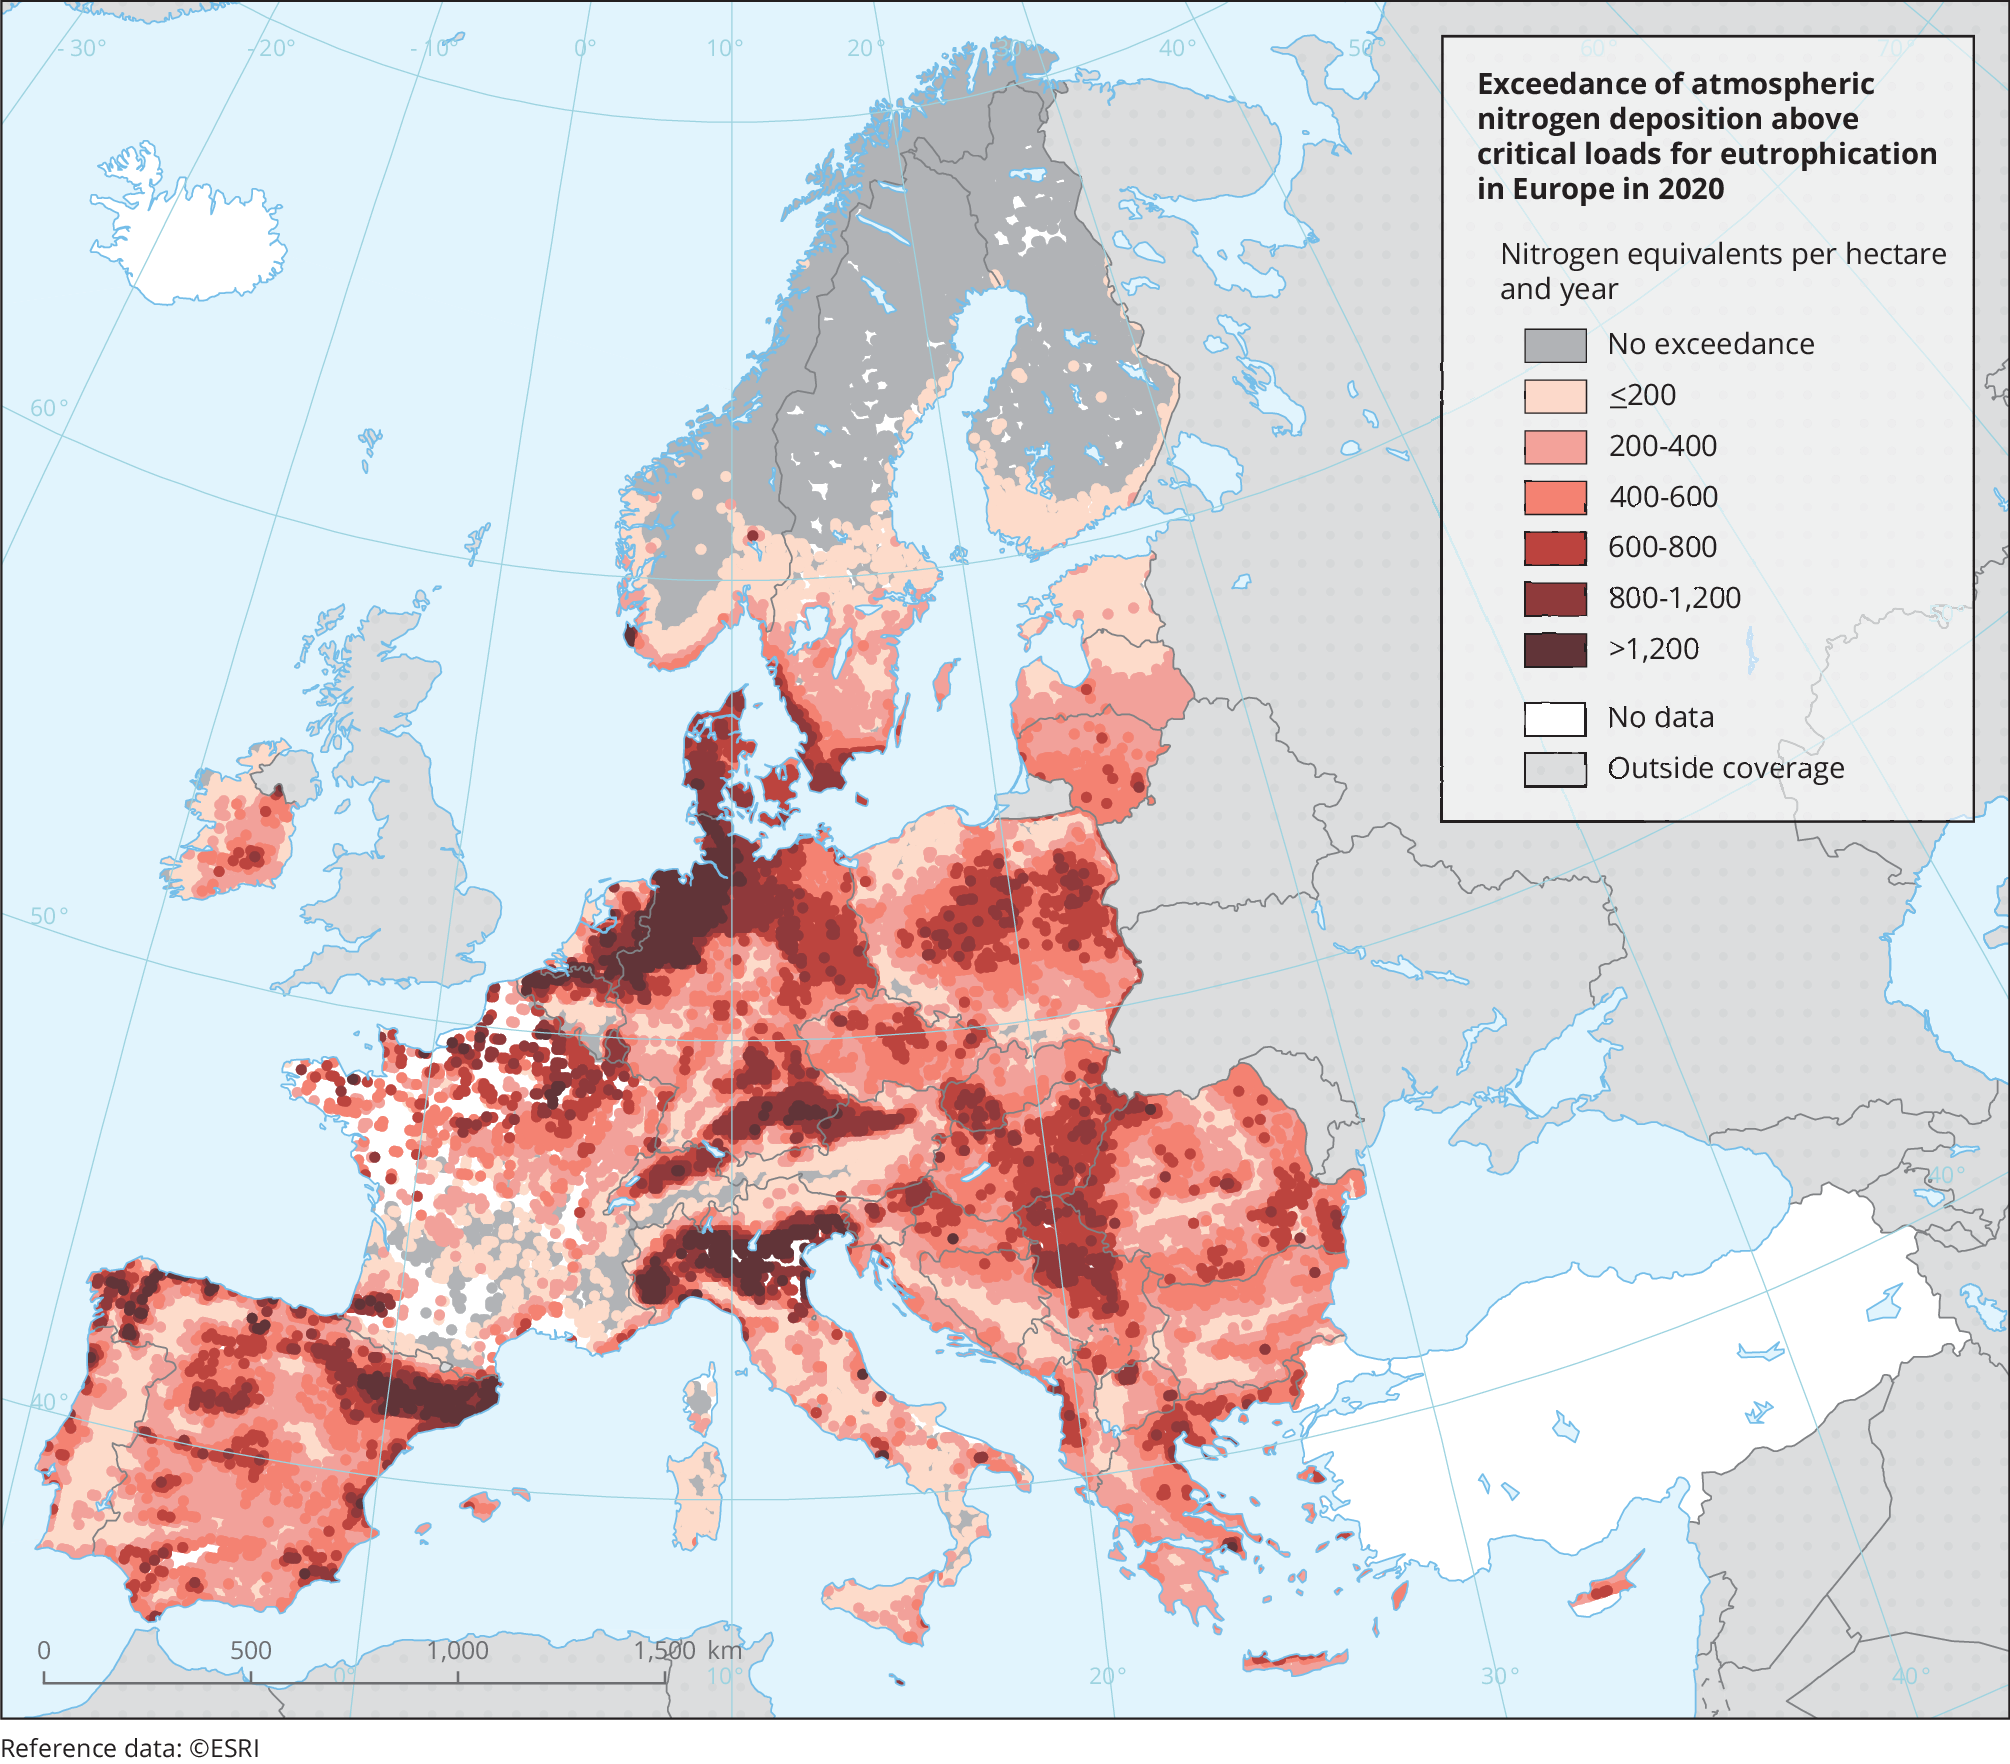
In 2005, nitrogen deposition in the EU-27 exceeded the critical loads for eutrophication in an ecosystem area of 1,235,900km2, i.e. 85.5% of the total EU-27 ecosystem area. Between 2005 and 2020, this area decreased by only 12%, as shown in Map 6. The zero pollution action plan target is to achieve a reduction of 25% by 2030 compared with 2005. Based on the current rate of improvement, the EU will not meet the target. The Third Clean Air Outlook (EC, 2022a) also suggests that the target will not be met without further measures and estimates a reduction of only 20% by 2030.


Notes: The map shows the ecosystem areas at risk of eutrophication in 2020. Critical loads refer to the upper limits of one or more pollutants deposited on the Earth’s surface that an ecosystem, such as nutrient-poor grasslands or forests, can tolerate without its function (e.g. the nutrient nitrogen cycle) or its structure (e.g. plant species’ richness) being damaged. If the deposition of airborne nitrogen (nitrate and ammonium compounds) is in excess of these critical loads, this is termed an ‘exceedance’, and an ecosystem is considered at risk of eutrophication. The map shows areas where critical loads are not exceeded (grey shading), indicating no risk of eutrophication, and where atmospheric nitrogen deposition exceeds critical loads, by magnitude of exceedance.
Eq N ha-1 yr-1, nitrogen equivalents per hectare per year.
Source: EEA (2022a).
Click here to view the map enlarged
Click here for different chart formats and data
Reducing emissions of NH3 to air will continue to be a significant challenge. For instance, 11 Member States failed to achieve their NH3 reduction targets for 2020. The latest data on the distance to the 2030 emission reduction targets indicate that only five Member States are currently on track to achieve their national NH3 targets (EEA, 2022b). Most Member States will need to significantly lower emissions to reach their 2030 commitments as explained. However, achieving the 2030 reduction targets for NH3 will not prevent all impacts of eutrophication on ecosystems. Further reductions will be needed to achieve the long-term ambitions of the zero pollution action plan.
For marine habitats, nutrient loading in rivers is the primary source of eutrophication. However, air pollution deposition can also make significant contributions. Further efforts are needed to reduce key air pollutant emissions, such as emissions of NH3 and NOX, as explored further in the zero pollution ‘Signal’ on the significance of airborne nitrogen deposition to the Baltic Sea.
Acidification
Acidification in ecosystems can be caused by atmospheric inputs of sulphur and nitrogen. Adverse effects on, for example, freshwaters and forest soils result from a decline in the pH value — leading to toxic metal mobilisation — and from nutrient losses from, for example, agriculture. In turn, this can result in forest decline or increased fish mortality. However, as a result of emission reductions over recent decades (see Figure 10), acidification is now less detrimental across Europe than eutrophication.
Acidification in ecosystems can be caused by atmospheric inputs of sulphur and nitrogen. Adverse effects on, for example, freshwaters and forest soils result from a decline in the pH value — leading to toxic metal mobilisation — and from nutrient losses from, for example, agriculture. In turn, this can result in forest decline or increased fish mortality. However, as a result of emission reductions over recent decades (see Figure 10), acidification is now less detrimental across Europe than eutrophication.
Ozone and ozone precursors
Excessive levels of ozone cause damage to plants, reducing their growth and leading to poorer food crop yields. Ozone is formed in the atmosphere from chemical reactions between NOX and volatile organic compounds (including methane). The primary way to reduce ozone levels is by controlling the emissions of these substances, otherwise known as ozone precursors. All ozone precursor emissions have declined over time, including emissions of NOX, non-methane volatile organic compounds (NMVOCs) and methane, as shown in Figure 11. NOX emissions reduced by 48% and NMVOC emissions by 31% between 2005 and 2020, while there was a more modest decrease in methane emissions of 17% over this period.
Notes: NOX = nitrogen oxides. NMVOCs = non-methane volatile organic compounds. CH4 = methane.
Source: EEA (2022c).
Click here for different chart formats and data
There is significant yearly variation in the percentage of EU agricultural land exposed to ozone levels above the EU’s long-term objective for vegetation. The percentage of agricultural land below the safe threshold of 6,000 μg/m3.hour has typically been 20% or less over the last 10 years (Figure 12). However, data suggest that reductions in ozone precursor emissions achieved to date have had little impact on crops’ exposure to ozone.
Notes: EU long-term objective for the protection of vegetation: 6 000 µg/m3.hour. EU target value for the protection of vegetation: 18,000 µg/m³.hour (averaged over five years).
Source: EEA (2022d).
Click here for different chart formats and data
Heavy metals
Heavy metals can be emitted from sources such as industrial activities and transport. Such pollutants present a risk to ecosystems because they can accumulate in soils, water habitats and sediments. Data on heavy metal emissions from EU Member States indicates that emissions of cadmium, mercury and lead have reduced significantly between 2005 and 2020 (EEA, 2022e). These developments are the result of EU actions taken to meet obligations under the Convention on Long-range Transboundary Air Pollution. From an industrial perspective, a significant proportion of the ecosystem impacts from heavy metals relates to emissions from a small number of installations involved in metal processing and fuel combustion (EEA, 2018b).
The zero pollution analysis on soils and ecosystems also shows how pollutants, including metals from other sources such as fertilisers (cadmium) and fungicides (copper), impact soil ecosystems. The zero pollution analysis on marine ecosystems includes information on the presence of hazardous substances in marine organisms.
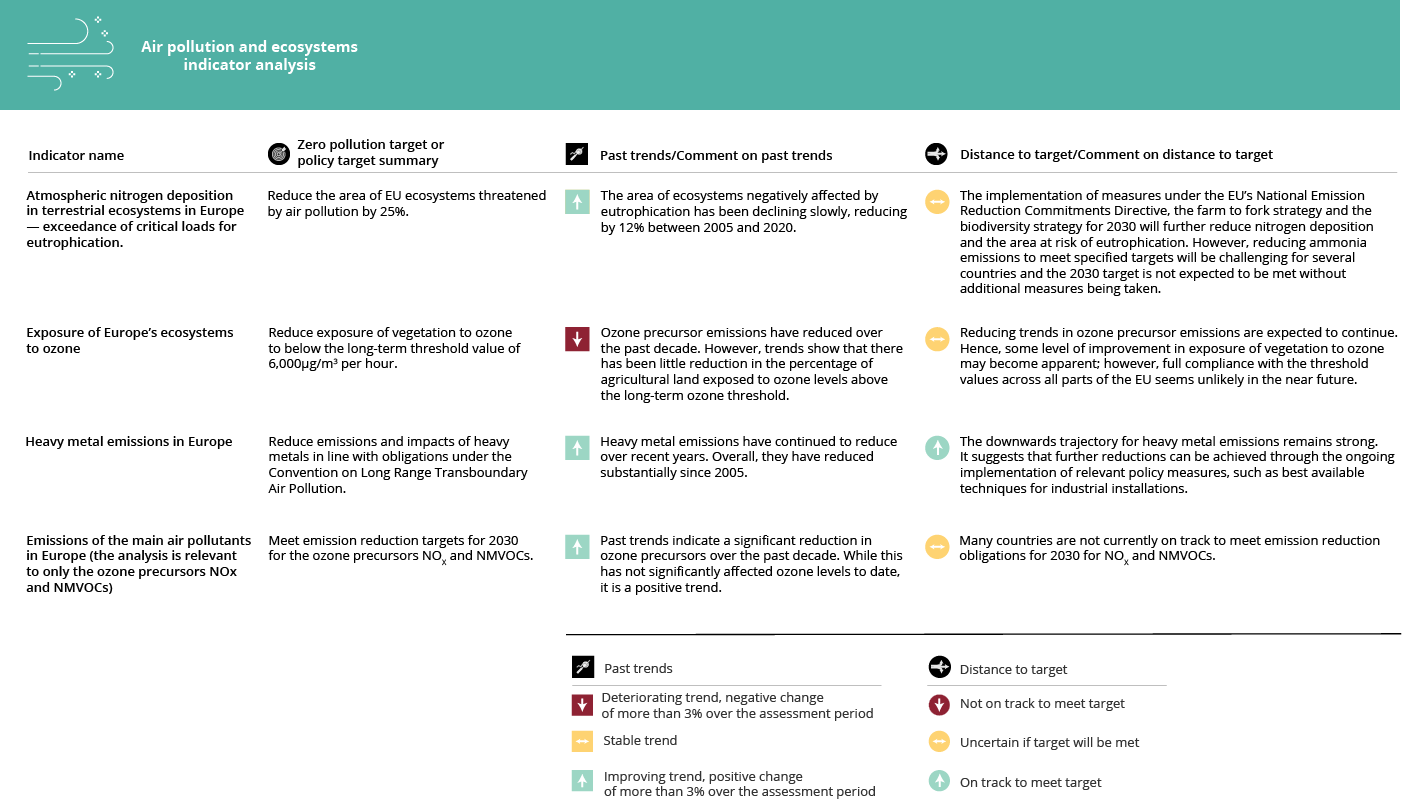
Note: Link to indicators: Exceedance of critical loads for eutrophication, Exposure of Europe’s ecosystems to ozone, Heavy metal emissions in Europe, Emissions of the main air pollutants in Europe.
Overview of indicator analysis methodology
This indicator analysis is in line with the approach taken by the EEA for its seventh environment action programme monitoring.
Past trends are based on assessment of the trend over the last 10 years (or since the relevant zero pollution baseline year where appropriate) with green, yellow or red being applied based on the criteria as outlined in the figure legend. Expert judgement is also applied, for example in cases where indicators are more qualitative and/or uncertain.
The distance to target is based on an assessment of the recent trend, current status and expert judgement.
Further detailed analysis of the future outlook for meeting certain zero pollution targets is included in the zero pollution outlook 2022, completed by the European Commission Joint Research Centre (JRC, 2022).
References
EEA, 2018a, Mercury in Europe’s environment — a priority for European and global action, EEA Report No 11/2018, European Environment Agency (https://www.eea.europa.eu/publications/mercury-in-europe-s-environment.) accessed 13 October 2022.
EEA, 2018b, ‘Environmental pressures of heavy metal releases from Europe’s industry’, European Environment Agency (https://www.eea.europa.eu/publications/environmental-pressures-of-heavy-metal) accessed 24 October 2022.
EEA, 2018c, Environmental indicator report 2018 — in support to the monitoring of the Seventh Environment Action Programme, EEA Report No 19/2018 (https://www.eea.europa.eu/publications/environmental-indicator-report-2018) accessed 13 October 2022.
EEA, 2021, ‘Air pollutant emissions data viewer (Gothenburg Protocol, LRTAP Convention) 1990-2020’, European Environment Agency (https://www.eea.europa.eu/data-and-maps/dashboards/air-pollutant-emissions-data-viewer-4) accessed 24 October 2022.
EEA, 2022a, ‘Atmospheric nitrogen deposition in terrestrial ecosystems in Europe – exceedance of critical loads for eutrophication’, European Environment Agency (https://www.eea.europa.eu/ims/eutrophication-caused-by-atmospheric-nitrogen) accessed 24 November 2022.
EEA, 2022b, ‘National Emission Reduction Commitments Directive reporting status 2022’, European Environment Agency (https://www.eea.europa.eu/publications/national-emission-reduction-commitments-directive-2022/national-emission-reduction-commitments-directive) accessed 24 October 2022.
EEA, 2022c, ‘Sources and emissions of air pollutants in Europe’, European Environment Agency (https://www.eea.europa.eu/publications/air-quality-in-europe-2022/sources-and-emissions-of-air) accessed 24 October 2022.
EEA, 2022d, ‘Exposure of Europe’s ecosystems to ozone’, European Environment Agency (https://www.eea.europa.eu/ims/exposure-of-europes-ecosystems-to-ozone) accessed 13 October 2022.
EEA, 2022e, ‘Heavy metal emissions in Europe’, European Environment Agency (https://www.eea.europa.eu/ims/heavy-metal-emissions-in-europe) accessed 24 October 2022.
EMEP, 2022, Transboundary particulate matter, photo-oxidants, acidifying and eutrophying components,EMEP Status Report 1/2022, European Monitoring and Evaluation Programme (https://emep.int/publ/reports/2022/EMEP_Status_Report_1_2022.pdf) accessed 13 October 2022.
JRC, 2022, Zero pollution outlook 2022, JRC129655, Publications Office of the European Union, Luxembourg, Joint Research Centre (https://joint-research-centre.ec.europa.eu/zero-pollution-outlook-2022_en) accessed 1 December 2022.
Cover image source: © Panagiotis Dalagiorgos, Well with Nature /EEA


Document Actions
Share with others