Key messages
- Increases in mean local sea levels are the main driver of observed and projected increases in extreme sea levels along the European coastline.
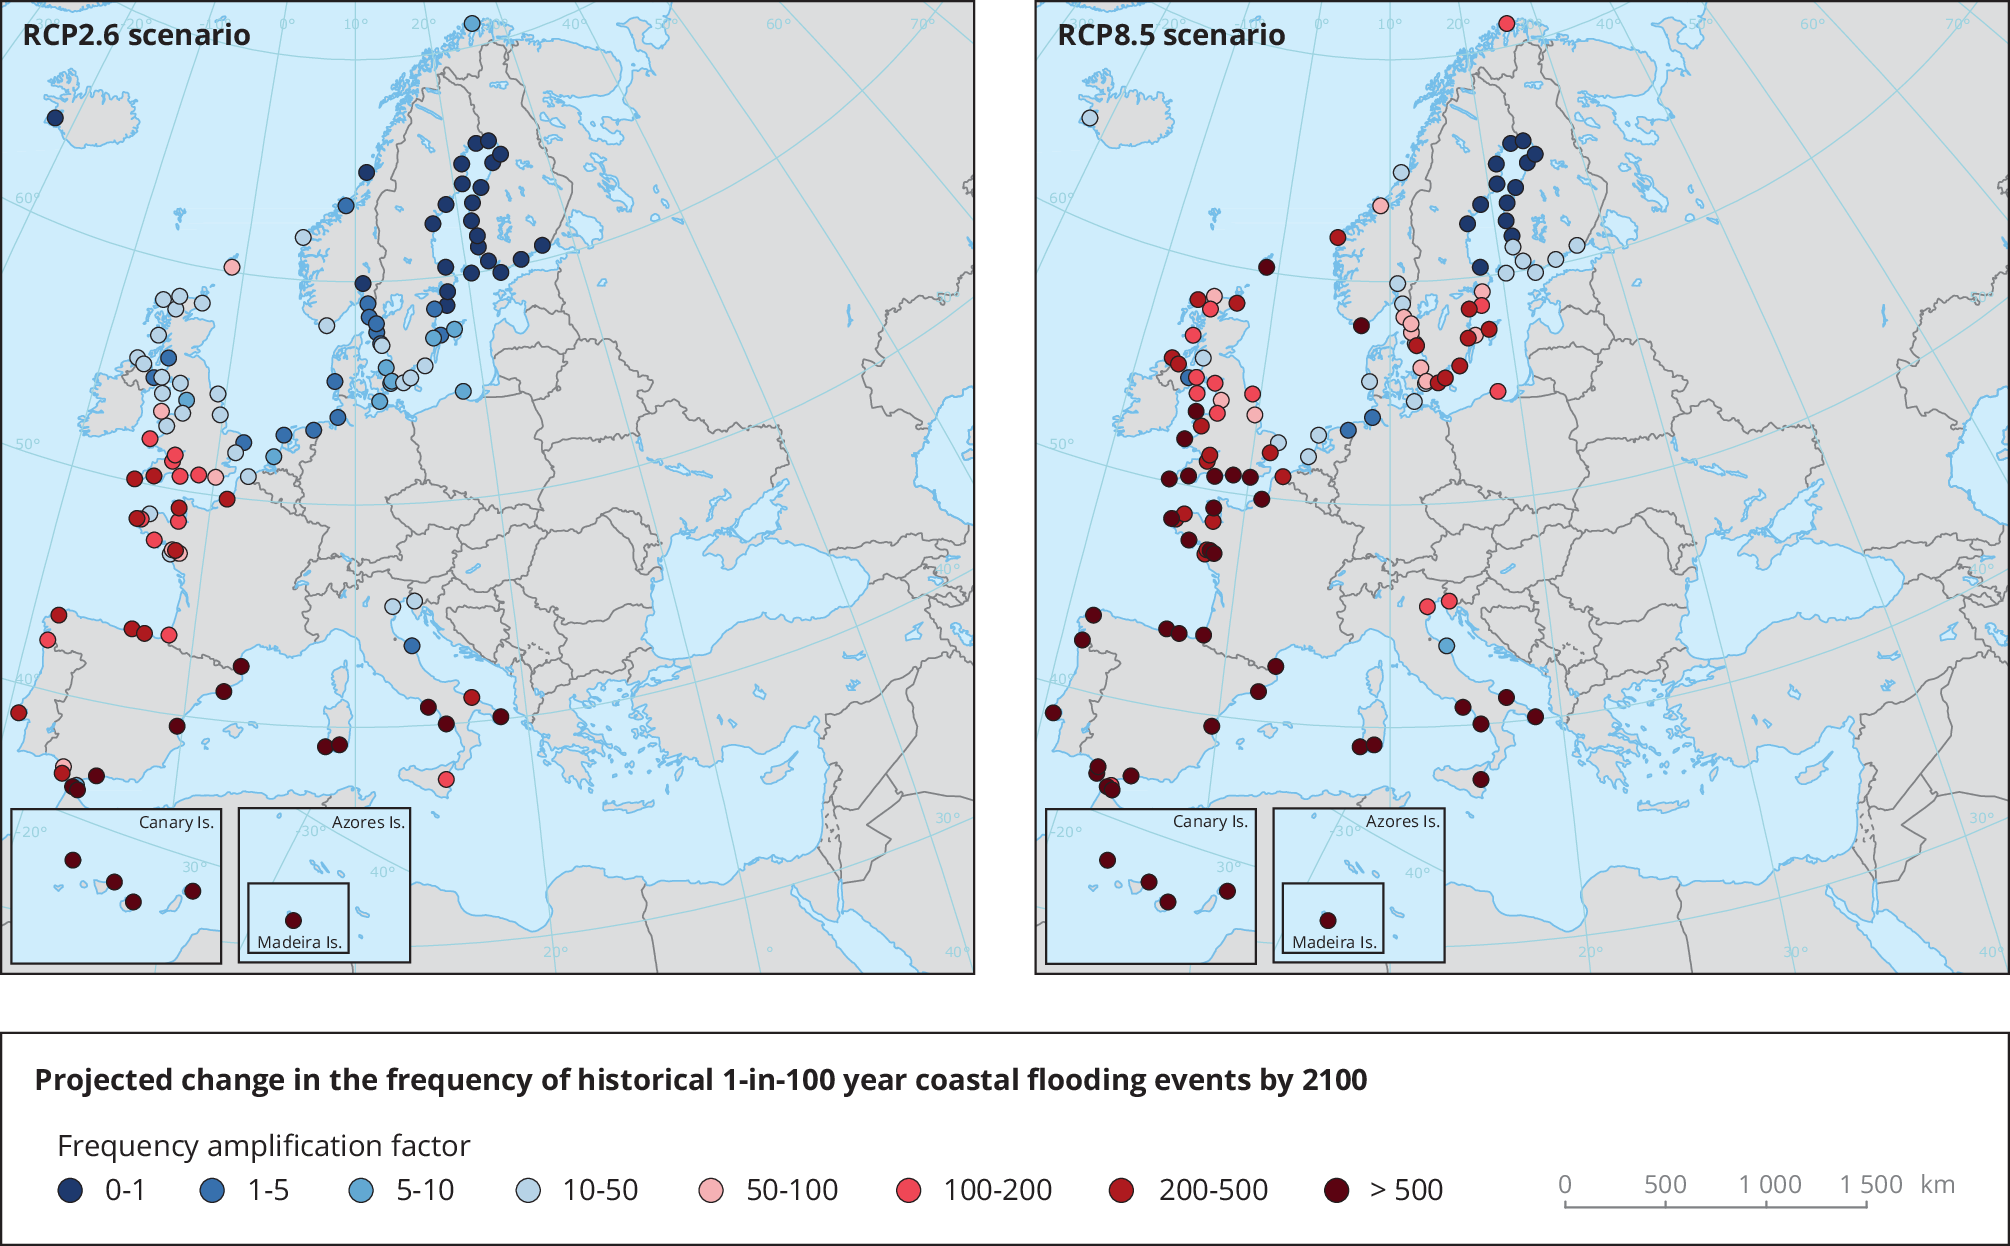
- With some limitations to the data, historical once-in-a-hundred-years coastal floods are projected to occur several times a year on the Mediterranean Sea and the Black Sea coasts, at least once a year along most other European coasts under a high-emissions scenario and at least once a decade along the remaining European coasts even under lower emissions scenarios.
- The only exception is the northern Baltic Sea, where current coastal floods are projected to become rarer as a result of continued land uplift following the last ice age.
Extreme sea level
Definition
The extreme sea level index represents the maximum sea water level along the coast corresponding to a 1-in-100-year coastal flood event.
Index factsheet (ETC/CCA Technical Paper): Extreme sea level
Relevance
This index is relevant for a wide range of applications in coastal regions, including regional planning, infrastructure design, coastal protection and ecosystem management.
Past and projected changes
Extreme sea levels along coastlines result from a combination of factors, including increases in local mean sea levels and tidal levels, storm surge events, waves and changes in coastal morphology. Changes in mean local sea levels are the main driver of observed and projected changes in extreme sea levels along the European coastline.
The past and projected changes in maximum sea water levels corresponding to 1-in-100-year events are not currently covered by a C3S data set. However, the projected changes in annual highest high water and in the frequency of 1-in-100-year coastal floods are available in the European Climate Data Explorer and in an EEA indicator assessment, respectively (see below).
As a result of the relative sea level rise projected by 2100, historical 1-in-100-year coastal floods are projected to occur several times a year along the Mediterranean and Black Sea coasts and at least once a year along most other European coasts under a high-emissions scenario (representative concentration pathway (RCP)8.5), and at least once a decade along the remaining European coasts even under the lowest emissions scenarios. The only exception is the northern Baltic Sea coast, where current coastal floods are projected to become rarer as a result of continued land uplift following the last ice age.
Note that the application of this index at the regional and local levels requires the integration of index information with regional information on land subsidence and coastal protection infrastructure.
Further information (European Climate Data Explorer): Annual highest high water, 2070-2100
Further information (EEA indicator assessment): Extreme sea levels and coastal flooding

Notes: The maps show the estimated change in the frequency of 1-in-100-year flooding events between 2010 and 2100 due to projected regional relative sea level rise under the low- and high-emissions scenarios (RCP2.6 and RCP8.5). Values larger than 1 indicate an increase in flooding frequency.
Sources: IPCC SROCC data on sea level rise; EEA indicator assessment Extreme sea levels and coastal flooding.
Notes: Solid coloured boxes show the ensemble mean values and coloured shading shows the full range of the model ensembles. The mean changes expected for the entire European coastline and for the coasts of 10 geographical regions are shown for (a) 2050 and (b) 2100.
Source: EEA indicator assessment Extreme sea levels and coastal flooding.
Document Actions
Share with others