Countries recently reported official data for 2015 to the European Pollutant Release and Transfer Register (E-PRTR) and separately for LCPs under the European Union’s (EU) LCP Directive. E‑PRTR data covers 35 000 facilities over 65 economic activities and is available for the EU-28 Member States (data for Italy had not been reported at the time of writing), the EFTA countries (Iceland, Liechtenstein, Norway and Switzerland) and Serbia. For LCPs, data is available for the EU-28 countries and Kosovo (UNSCR 1244/99). Data for both Serbia and Kosovo are reported voluntarily and are not included in this briefing analysis.
The updated E-PRTR data show, for each facility, information concerning the amounts of pollutant released in 2015 to air, water and land as well as off-site transfers of waste and of pollutants in wastewater. The top polluters were identified as those sites having the top ten largest individual releases to air and water for each of nine key pollutants:
|
Air pollution
|
Water pollution
|
|---|
- carbon dioxide (CO2)
- sulphur dioxide (SO2)
- nitrogen oxides (NOx)
- PM10 particulate matter
- heavy metals (combined releases of cadmium (Cd), mercury (Hg) and lead (Pb)).
|
- total nitrogen (N)
- total phosphorous (P)
- total organic carbon (TOC)
- heavy metals (combined releases of cadmium (Cd), mercury (Hg), nickel (Ni) and lead (Pb)).
|
Note that since the reporting year of 2015, changes in E-PRTR operating facilities may have occurred. Official data for 2016 will be available in June 2018.
Top polluting industrial facilities in Europe
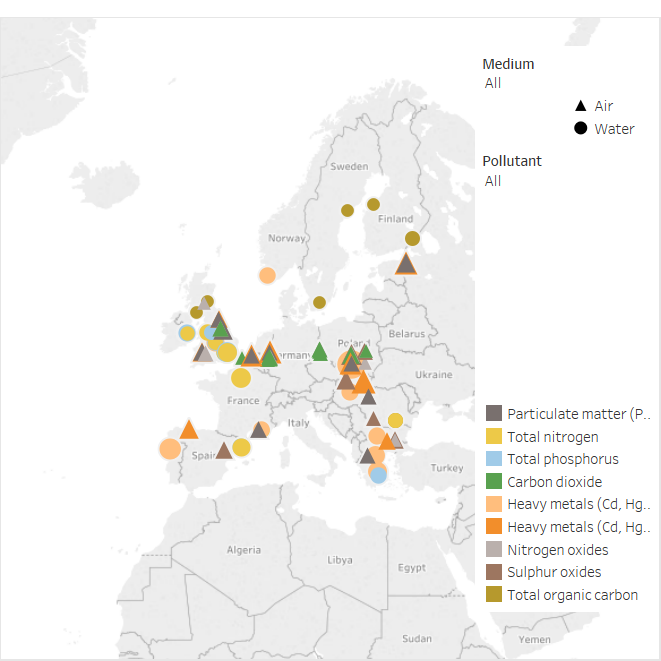
The top industrial polluting facilities are located throughout Europe and, not surprisingly, they are often clustered in areas with high industrial activity (Figure 1). Half of the identified facilities responsible for the largest releases of pollutants to the environment are located in the United Kingdom (14 facilities), Germany (7), Poland (5) and France (5). A number of facilities are responsible for large releases of more than one of the nine selected key pollutants — overall 59 individual facilities are included in the list of top polluters (Table 1).

Click here for full screen version
Source: The European Pollutant Release and Transfer Register (E-PRTR), Member States reporting under Article 7 of Regulation (EC) No 166/2006
Note: The size of symbols reflects the magnitude of pollutants. Italy did not meet the deadline for submitting E-PRTR data for 2015 and is not included.
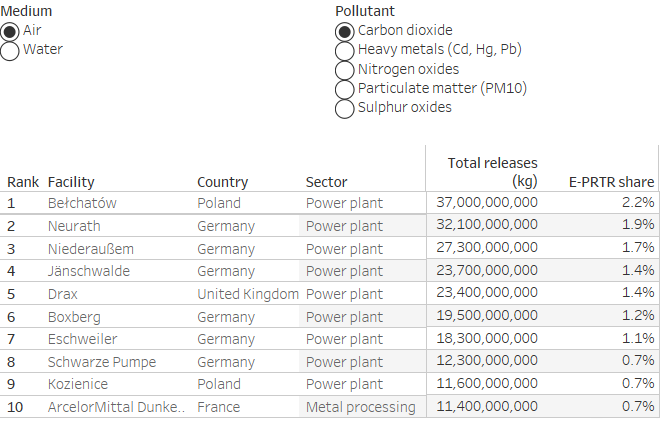
For air, four facilities — all of them coal fired power plants — appear as top polluters for three different pollutants (CO2, SO2 and NOx):
- Bełchatów (Poland) — Europe’s largest thermal power station firing lignite;
- Drax (UK) — powered by hard coal, and biomass mainly sourced from North America;
- Jänschwalde (Germany) — predominantly lignite-fired power station;
- Kozienice (Poland) — Poland’s second largest coal-burning power station.
Of the 65 economic activities included in E-PRTR, power plants were responsible for Europe’s largest individual facility releases of SOx and NOx, and comprised all but one of the facilities releasing the most CO2 to air. All of these power plants are fuelled predominantly by coal except the Eesti plant in Estonia which is fuelled by oil shale. In contrast, the most polluting facilities for heavy metals were, with one exception, metal production and processing sites. These sites also comprised seven of the top ten facilities emitting PM10.
For water, four wastewater treatment plants (WWTPs) reported the largest releases of three different pollutants:
- Seine Aval (France; releases of N, P and TOC)
- Beckton (United Kingdom; releases of N, P and TOC)
- Ringsend (Ireland; N, P and TOC)
- Minworth (United Kingdom, releases of Heavy metals, N and P)
It is important to note that wastewater treatment plants only release pollutants into water that they have received from other sources through transfers (receipts) of wastewater. Although featuring prominently in the list of most polluting facilities, they are not themselves the original source of the pollutants. Overall, 31 different wastewater treatment plants accounted for all of the highest N and P releasing facilities, as well as the majority of TOC and heavy metals releases to water.

Source: The European Pollutant Release and Transfer Register (E-PRTR), Member States reporting under Article 7 of Regulation (EC) No 166/2006
A small number of facilities contribute a relatively high share of the total releases of pollutants from all E-PRTR facilities for several key pollutants. Particularly for heavy metals, several individual facilities contributed more than 5 % of all reported emissions from E-PRTR facilities in 2015, including:
- Bolesław metals mine (Poland; 10.5 % of heavy metals released to water);
- U.S. Steel Košice metal production and processing site (Slovakia; 7.5 % of heavy metals released to air);
- Eesti oil shale-fired power plant power plant (Estonia; 7.1 % of heavy metals released to air).
Information on releases to air and water from industrial facilities in the years prior to 2015 is also shown in the E-PRTR website. A comparison of the updated 2015 data with those for earlier years shows that, overall, the reported releases of key air pollutants from industry continued to decline in 2015. Releases of TOC and heavy metals to water also fell, while N and P releases remained stable for the third year in a row.
In the spotlight: large combustion plants
Large combustion plants that generate heat and/or electricity are defined in the LCP Directive as those facilities having an installed capacity greater than 50 megawatts thermal energy (MWth). They are common in the electricity and heat supply sectors, oil refineries and in other sectors such as chemical industries and iron and steel production.
In the EU-28, the number of LCPs has decreased slightly over the last four years. In 2015, around 3 400 LCPs were in operation. The latest officially-reported data from national authorities show that the consumption of fossil fuels by LCPs has decreased by 23.4 % since 2006. These decreases occurred while EU-28 Member States reduced their electricity consumption only moderately, i.e. by 3.3 % since 2006 (Eurostat, 2017). This reflects factors such as improving energy efficiency within the sector and the shift of Europe’s energy system away from coal, gas and oil to other energy sources such as renewables (EEA, 2017).
Despite the share of coal decreasing for the third year in a row, it nonetheless remains the dominant fuel used in LCPs, accounting for more than half (55 %) of the total fuel energy input. Combustion of coal typically generates more greenhouse gas and air pollutant emissions per energy unit than other fossil fuels. The use of natural gas increased slightly between 2014 and 2015 to 26.1 % of fuel input. The use of biomass fuels increased threefold between 2004 and 2015, but contributed a relatively minor share (4.7 %) of LCP fuel use in 2015.
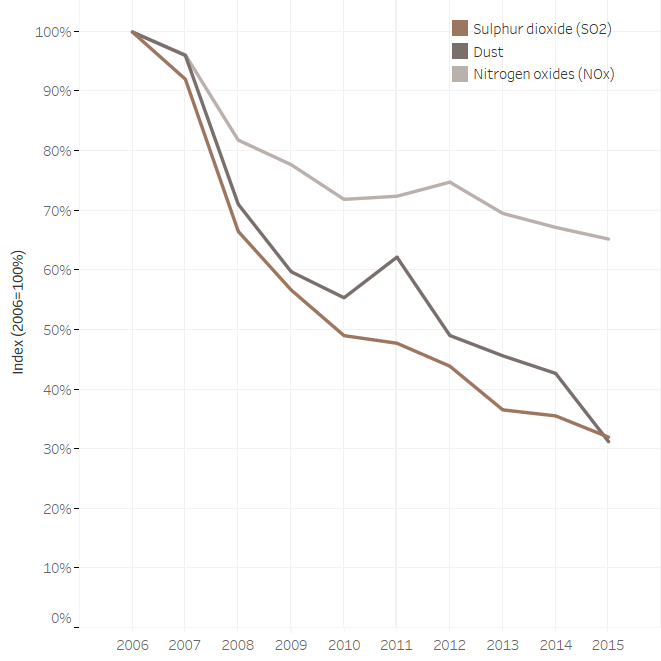
LCPs have significantly improved their environmental performance over the past decade in terms of pollutant emissions per unit of energy consumed (Figure 2). While changes in the energy mix and the retrofitting of certain plants explain part of the changes, the sector also benefitted from a significant uptake of emission abatement techniques in existing plants. This has, at least in part, been driven by the requirements of the EU’s LCP Directive and implementation of the more recent Industrial Emissions Directive, which includes emission standards for existing LCPs.

Source: Reported data on large combustion plants covered by Directive 2001/80/EC
Although the LCP sector is continuing to improve its environmental performance, it remains an important source of emissions, at levels that continue to contribute to poor air quality across Europe. It is evident that the LCP sector needs to shift more rapidly from fossil fuel combustion in order for the EU to achieve its climate and energy policy goals for 2030 and beyond. A recent EEA study (EEA, 2016) highlighted that the transition needed in the energy sector towards alternative technologies is lagging and warns that a commitment to strengthen investment in clean technology and restructure the fossil fuel-based energy infrastructure is needed to ensure a secure and affordable future power supply in the EU.
Document Actions
Share with others