The briefing updates earlier work undertaken by the EEA and its European Topic Centre on Health and Environment (ETC-HE) (Schucht et al., 2021; EEA, 2021). A technical note, with details on the methodology and additional results, accompanies this briefing (Estimating the external costs of industrial air pollution: Trends 2012-2021: Technical note on the methodology and additional results).
Box 1. Scope and novelties: Estimating marginal damage costs per pollutant
Compared to the previous work (EEA, 2021), the current analysis has four new elements:
- The methodology has been updated with new scientific information and modelling.
- Year-on-year damage costs per tonne of pollutant have been estimated, rather than a single value for all years. This was done to account for the effect of demographic changes on the calculation of health impacts.
- Improvement of the adjustment factors used to account for the differences in emission patterns by the various industrial sectors in the scope. Now, it not only considers the different exposure patterns between sectors but also considers the different proportion of Particulate matter (PM) fractions present in each sector and country.
- The geographical scope of the industrial facilities included in the assessment now focuses only on the EU-27, whereas the previous briefing included facilities located in non-EU countries and the UK (then still reporting to the European Pollutant Release and Transfer Register (E-PRTR)). However, the impact of the EU facilities is still calculated for countries beyond the EU-27, (Albania, Bosnia and Herzegovina, Iceland, Kosovo, Liechtenstein, Montenegro, North Macedonia, Norway, Serbia, Switzerland, and Turkey). This means that the analysis now strongly focuses on the impacts of the EU’s industry on the EU and neighbouring countries. More details are available in the technical note relating to this briefing (Estimating the external costs of industrial air pollution: Trends 2012-2021: Technical note on the methodology and additional results).
EU industry in context
In recent years, European industry has faced the hurdles of global disturbances to logistics routes during the COVID-19 pandemic, including risky dependencies from a small number of countries for key resources. Since 2022, the additional challenges posed by Russia’s war of aggression against Ukraine have increased the prices of raw materials and have made energy security a more critical issue.
In 2021, the European Commission unveiled its industrial strategy, which focused on bringing back production, reducing the EU’s dependency on unstable or opaque economies for supplying critical raw materials, and a green and digital transition. The subsequent proposal for a Net Zero Industry act also aims to address key drivers of net-zero technology manufacturing by improving investment certainty, streamlining administrative processes, facilitating market access, supporting carbon capture and storage/utilisation projects, promoting innovation and skills development, and coordinating industrial partnerships (EC 2021a; 2023).
Part of this transition is also about reducing pollution to levels that no longer pose a risk to humans and the environment. One of the key pillars of the EU Green Deal – the EU’s ambitious and comprehensive strategy to transform the EU into a climate-neutral and sustainable economy by 2050 – is the Zero Pollution Action Plan (EC, 2019; 2021b). The plan has targets covering air, water, and soil pollution, with focus on health impacts, ecosystems, and production-consumption value chains. The latter includes using chemicals management (safe and sustainable by design) and the circular economy as means to achieving zero pollution in product manufacturing.
The EEA’s Zero Pollution Monitoring Assessment (EEA, 2022) shows that although there has been some progress, emission trends have stagnated in recent years and a transformation from industry in line with the long-term policy objectives would require significant new actions and investments towards 2050. In addition, certain production has relocated to non-EU countries, so part of past progress could be hampered by emissions produced elsewhere in the manufacturing process of products (Figure 1).
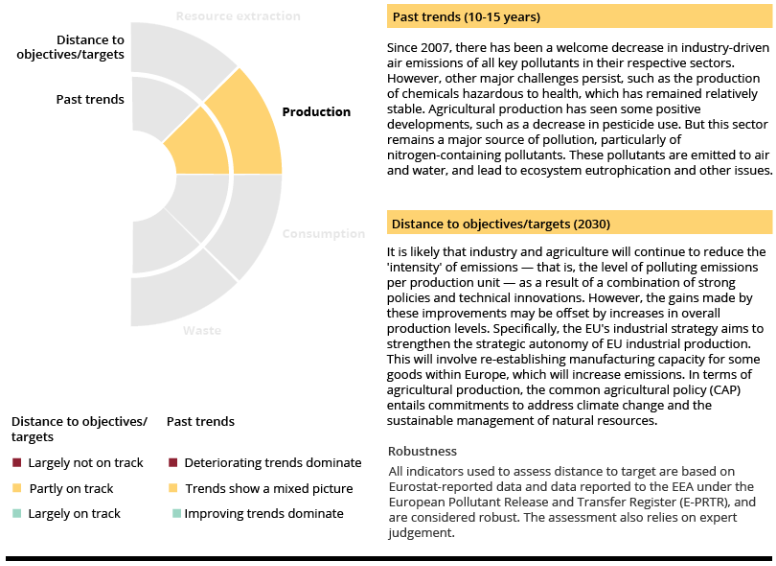
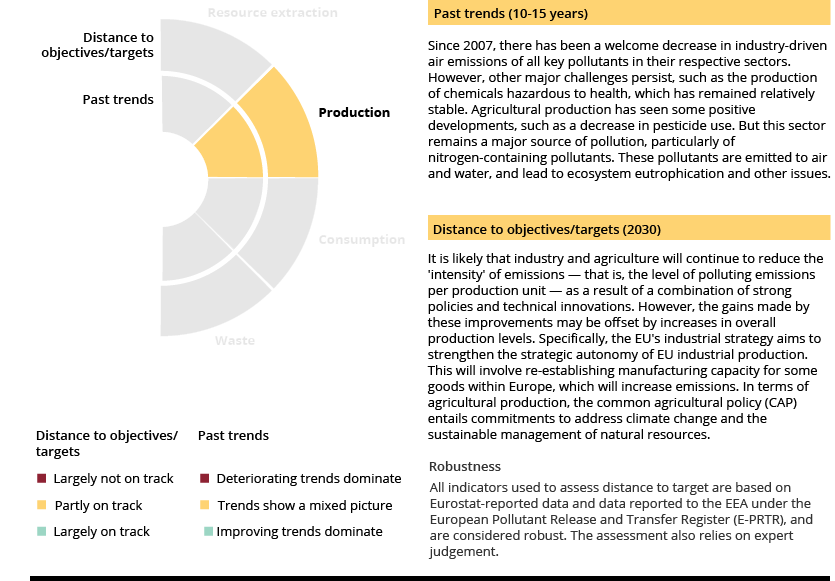
Source: EEA, 2022.
Understanding the trends and patterns of industrial emissions provides valuable insights into the effectiveness of current measures and the need for developing further transformative approaches to ensure a sustainable and low-pollution future.
Box 2. Methodological steps for estimating the external costs of industrial air pollution
- Emissions to air reported by industry to the European Industrial Emissions Portal: The industries in scope are large operators such as power plants, refineries, or steelworks. The ‘About’ section of the Portal includes the range of activities. This comprises a scope of circa 30,000 industrial facilities, of which around 10,000 report air emissions from the pollutants assessed in this study every year, with the remainder reporting only water emissions and/or waste and pollutant transfers.
- Dispersion/atmospheric chemistry modelling: This modelling enables understanding of where pollution would likely end up after being emitted.
- Exposure assessment: A calculation of the extent to which the population and the environment are exposed to the different pollutants, by combining spatial concentration and deposition data with data on population, crops, forests, and location of Natura 2000 protected areas, among other factors.
- Impact assessment: An analysis of how this pollution is likely to affect the population (mortality and morbidity) and the environment based on a defined set of response functions combined with exposure data.
- Economic valuation of impacts: Calculation of the monetary value of those impacts based on peer-reviewed literature and established economic methods. For the main air pollutants (NH3, NOX, PM10, SO2, and NMVOCs), the estimation of mortality impacts was done using two distinctive methods:
- Value of statistical life (VSL): an estimate of damage costs based on the value a given population places ex ante on avoiding the death of an individual. VSL is based on the sum of money each individual is prepared to pay for a given reduction in the risk of premature death, for example from diseases linked to air pollution (OECD, 2012); and
- Value of a life year (VOLY): an estimate of damage costs based on the potential years of life lost (YOLL) from a specific risk, based on an estimated life expectancy, and then evaluated by multiplying them by the VOLY. Therefore, the result is affected by the age at which deaths occur (OECD, 2012).
- The ranges of external costs included in the results of this briefing correspond to the values estimated using these two methods, rather than quoting a minimum/maximum level of health impacts.
What were the external costs of industrial air emissions during the last decade?
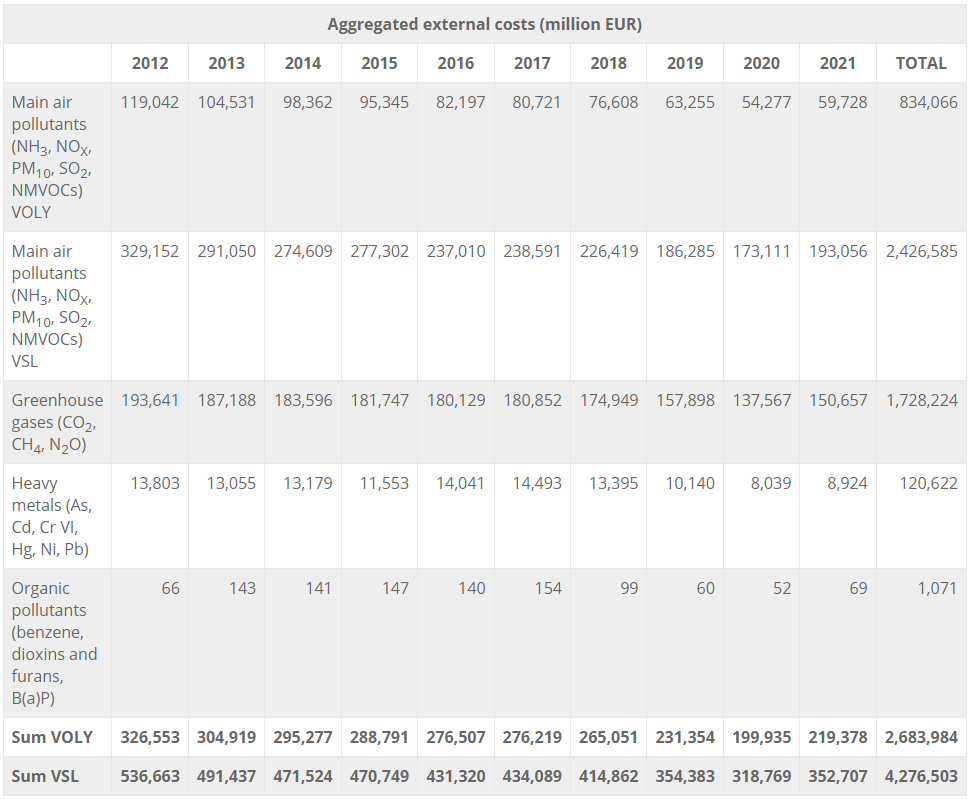
During the last ten years of available data in the European Industrial Emissions Portal (2012-2021), industrial air emissions had an estimated external cost of between EUR 2.7 to EUR 4.3 trillion, averaging between EUR 268 to EUR 428 billion per year (see Table 1). These external costs have decreased consistently (-33%) over the decade. This suggests that policies to mitigate and control pollution and other factors, such as the use of less carbon-intensive fuels, have had a positive impact leading to decreased environmental damage and associated societal costs. However, significant costs persist, indicating the need for continued action to further reduce pollution levels and associated impacts. In 2021, the external costs of industrial air pollution from the large industrial operators included in this study were equivalent to approximately 2% of the EU’s GDP.
Over the past 10 years, a sharper drop compared to previous years is noticeable in 2020 due to the COVID-19 pandemic, followed by a rebound effect in 2021 when a higher rate of industrial activities resumed to a certain extent.
Total external costs for 2021 are dominated by the main air pollutants (27-55%), depending on whether the value of a life year (VOLY) method or the value of statistical life (VSL) are used[1], followed by greenhouse gases (GHG) at 43-69%[1], [2], heavy metals at 3-4%[1] and organic pollutants at 0.02-0.03%[1]. The relative proportion of external costs caused by GHGs has increased during the 2012-2021 period.
| Aggregated external costs (million EUR) |
|
2012 |
2013 |
2014 |
2015 |
2016 |
2017 |
2018 |
2019 |
2020 |
2021 |
TOTAL |
| Main air pollutants (NH3, NOX, PM10, SO2, NMVOCs) VOLY |
119,042 |
104,531 |
98,362 |
95,345 |
82,197 |
80,721 |
76,608 |
63,255 |
54,277 |
59,728 |
834,066 |
| Main air pollutants (NH3, NOX, PM10, SO2, NMVOCs) VSL |
329,152 |
291,050 |
274,609 |
277,302 |
237,010 |
238,591 |
226,419 |
186,285 |
173,111 |
193,056 |
2,426,585 |
| Greenhouse gases (CO2, CH4, N2O) |
193,641 |
187,188 |
183,596 |
181,747 |
180,129 |
180,852 |
174,949 |
157,898 |
137,567 |
150,657 |
1,728,224 |
| Heavy metals (As, Cd, Cr VI, Hg, Ni, Pb) |
13,803 |
13,055 |
13,179 |
11,553 |
14,041 |
14,493 |
13,395 |
10,140 |
8,039 |
8,924 |
120,622 |
| Organic pollutants (benzene, dioxins and furans, B(a)P) |
66 |
143 |
141 |
147 |
140 |
154 |
99 |
60 |
52 |
69 |
1,071 |
| Sum VOLY |
326,553 |
304,919 |
295,277 |
288,791 |
276,507 |
276,219 |
265,051 |
231,354 |
199,935 |
219,378 |
2,683,984 |
| Sum VSL |
536,663 |
491,437 |
471,524 |
470,749 |
431,320 |
434,089 |
414,862 |
354,383 |
318,769 |
352,707 |
4,276,503 |
Notes: For the main air pollutants, the lower value of the range is a calculation of mortality using VOLY, while the upper value uses VSL.
Euro price base: 2021.
Data gaps: Czechia (2021), Malta (2020-2021), Lithuania (2020-2021) and Slovakia (2018-2021). This data has been projected using the latest reported year for the summaries at EU level (by pollutant group and by sector), but not when individual countries or facilities are presented.
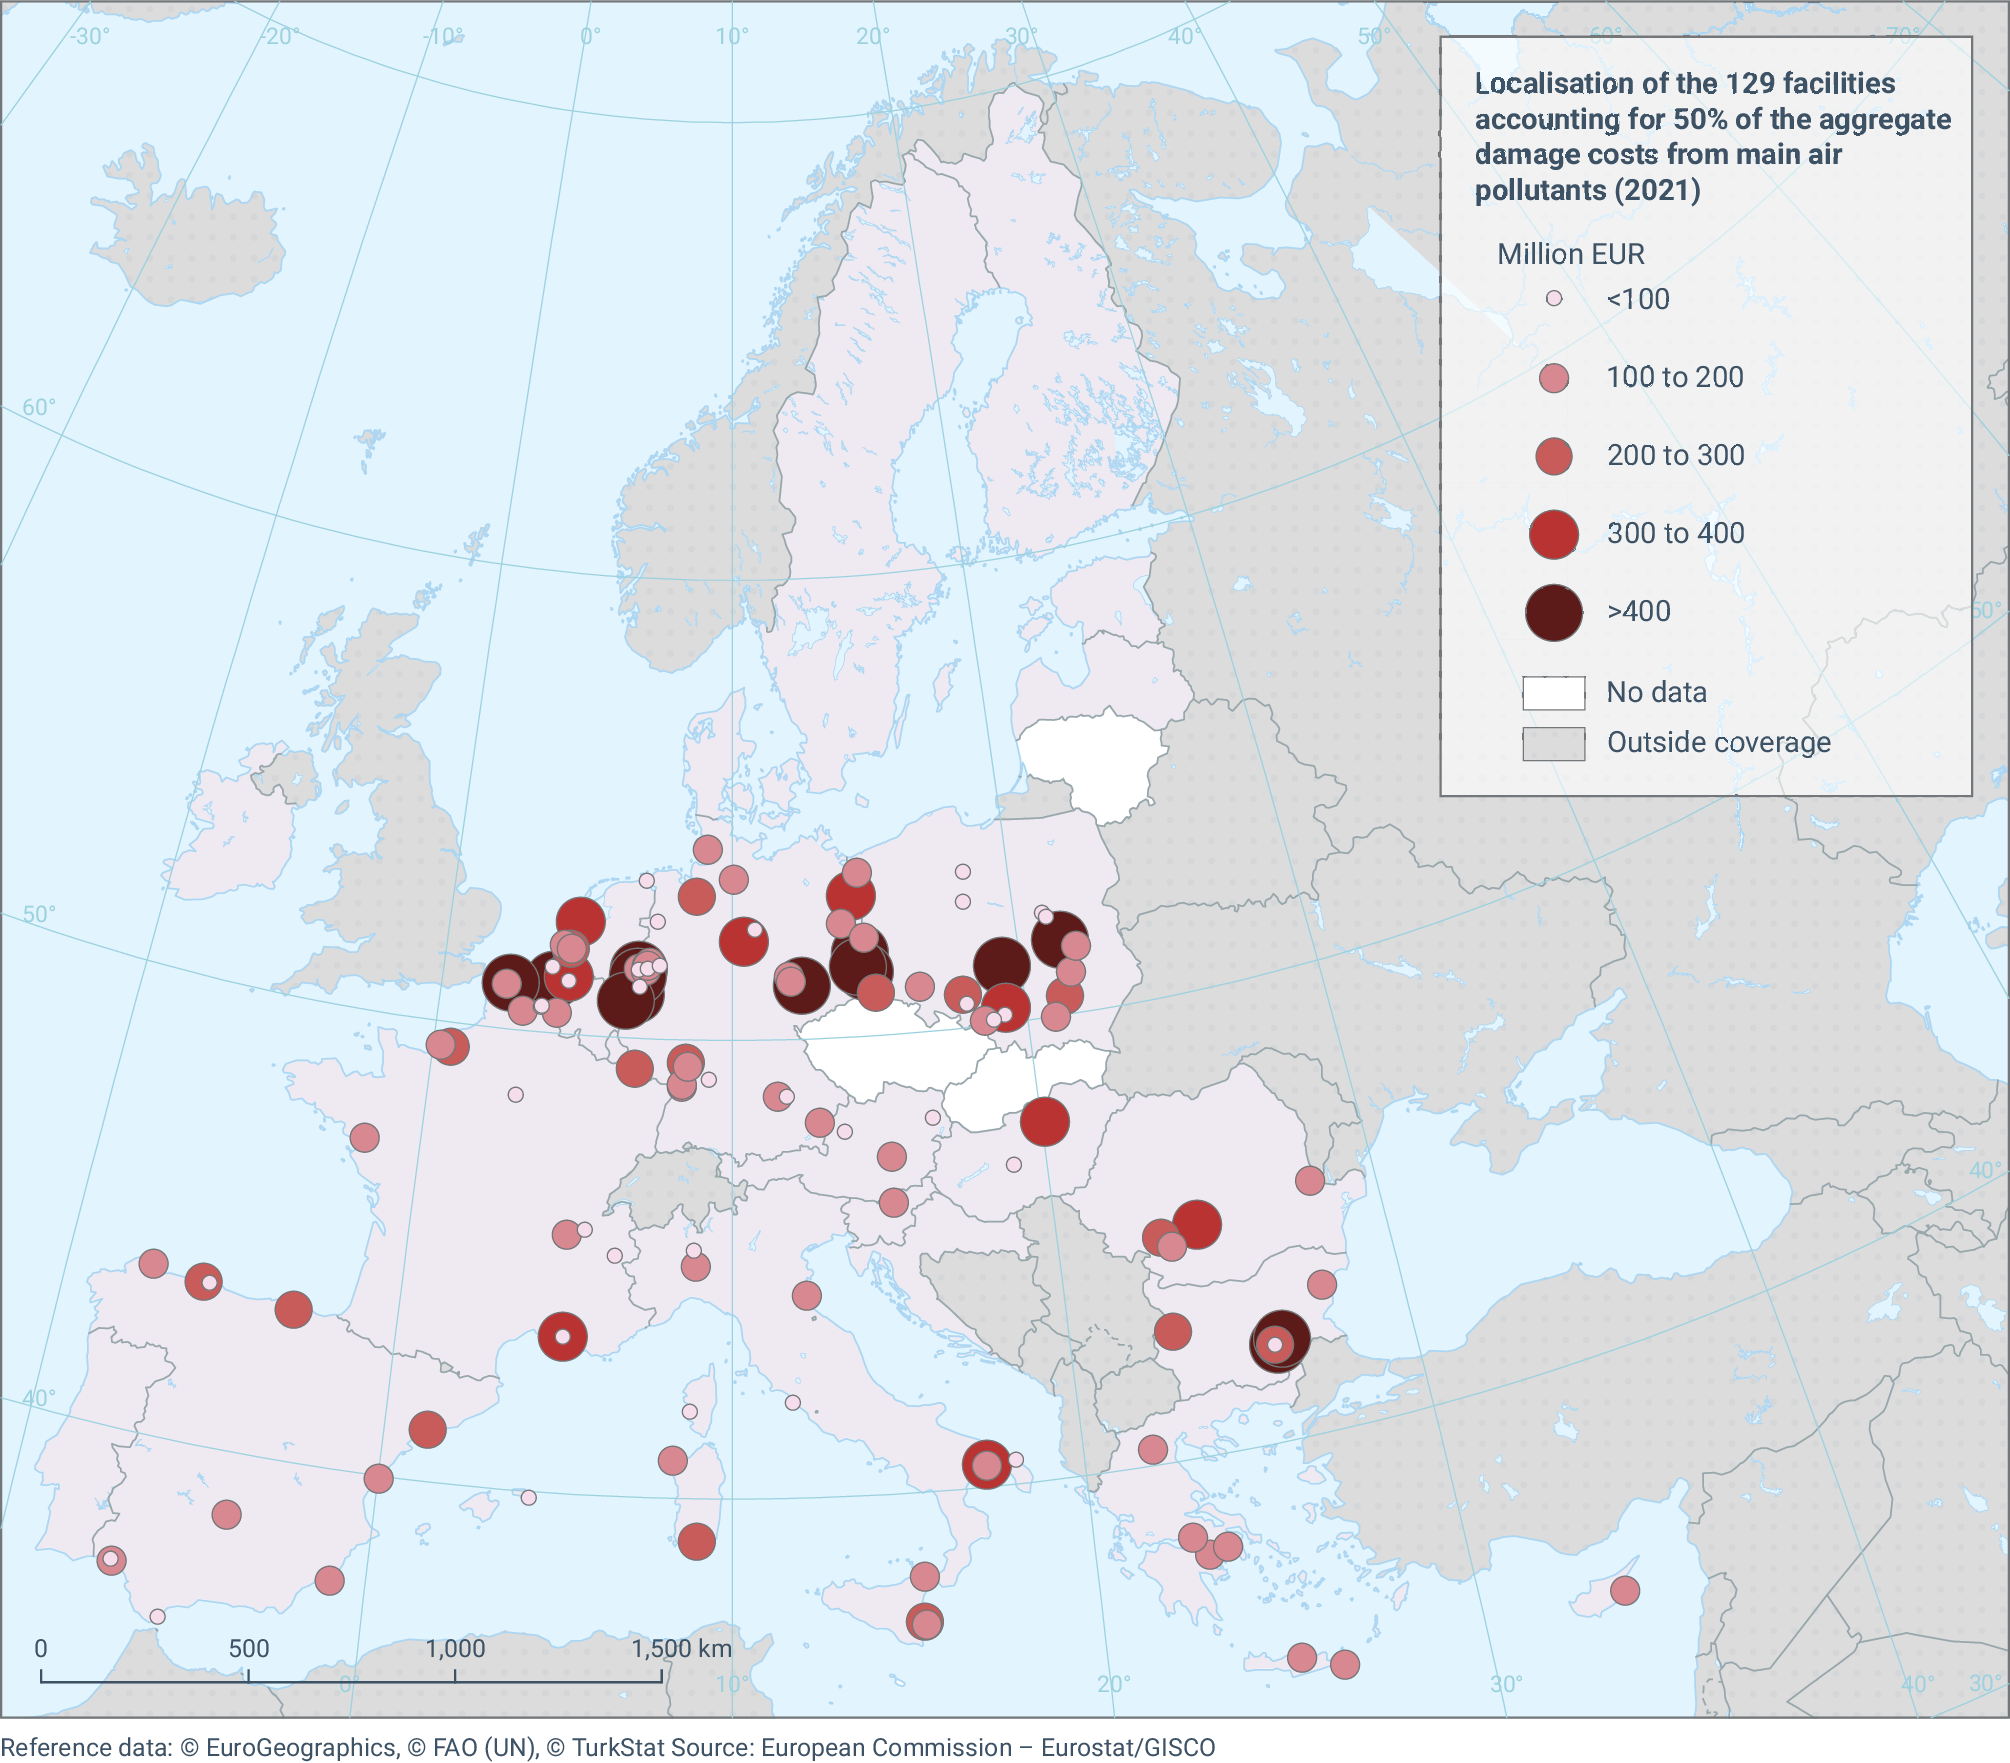
As shown in Map 1 below, and consistent with earlier analysis from the EEA and the European Topic Centre (ETC), a small number of facilities remain responsible for 50% of the external costs caused only by the main air pollutants, e.g. in 2021 just 129 (1.3%) of the 9,400 facilities. It is worth noting that half (25) of the 50 most polluting facilities in 2021 were thermal power stations, with most of them located in Germany (nine) and Poland (six). Twenty-three of these 25 plants burn lignite or hard coal as their main fuel.
Corrigendum, 29/4/2024
Notes: Mortality valued using the value of a life year (VOLY).
Euro price base: 2021.
Data gaps: Czechia, Malta, Lithuania, and Slovakia. No data reported for 2021.
Source: See technical note (Estimating the external costs of industrial air pollution: Trends 2012-2021: Technical note on the methodology and additional results).
Click here for different chart formats and data
The updated assessment also identifies the sectors with the highest externalities. Over the decade (2012-2021), the highest external costs were caused by the energy sector, followed by heavy industry, fuel production and processing, light industry, waste management, livestock[3] and wastewater treatment[4].
The ranking of relative contributors to the total damage costs is the same in 2021 as during the decade (see above paragraph), but the energy sector has been cutting emissions at a higher rate than the other sectors. Almost 80% of the decrease of total external costs during the study period corresponds to this sector (Figure 2). This has been driven by the successful implementation of the best available techniques (BAT) in the sector via European environmental legislation from the last decades, including Directive 2001/80/EC of the European Parliament and of the Council of 23 October 2001 on the limitation of emissions of certain pollutants into the air from large combustion plants (LCPD), earlier legislation tackling large power stations, Directive 96/61/EC of 24 September 1996 concerning integrated pollution prevention and control (IPPCD) and more recently the Industrial Emissions Directive (IED) – Directive 2010/75/EU of the European Parliament and of the Council of 24 November 2010 on industrial emissions. Climate policy has also played a major role in the shift from coal to natural gas (as a transitionary fuel) and the increase in renewables seen in the last 25 years, which has also contributed successfully to the reduction of air emissions from power stations (EEA, 2019; 2023).
Whereas the energy sector has always represented the biggest source of external costs from industrial air emissions (around 50%), other sectors have become increasingly important as their relative decrease in external costs has been lower and they now represent a bigger proportion of industrial pollution. The need for tighter control and better environmental performance was also one of the key themes in the European Commission’s proposal for the revision of the IED, which has a strong focus on applying the most stringent emission limits and reducing the opportunity of using derogations (EC, 2022).
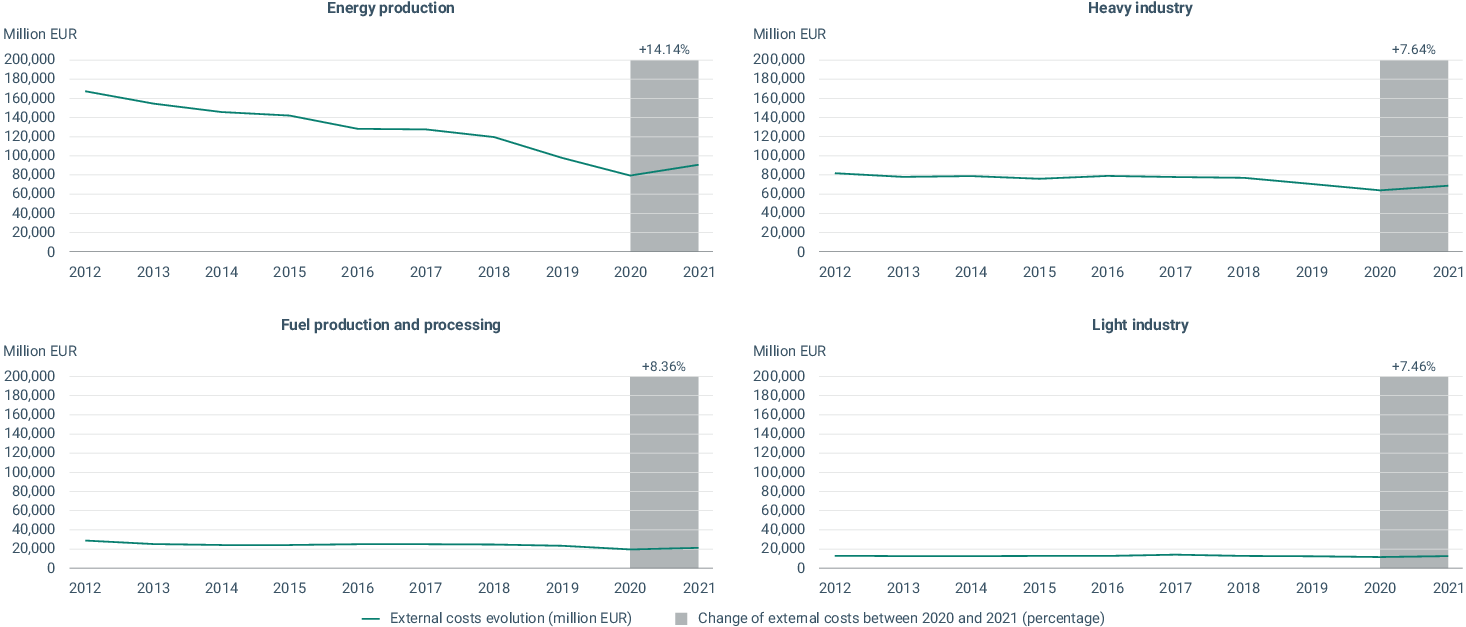
Notes: Mortality valued using the value of a life year (VOLY).
Euro price base: 2021.
Data gaps: Czechia (2021), Malta (2020-2021), Lithuania (2020-2021) and Slovakia (2018-2021). This data has been projected using the latest reported year for the summaries at EU level (by pollutant group and by sector), but not when individual countries or facilities are presented.
In addition to the sectors shown in the Figure 2, the analysis also covered livestock (i.e. intensive rearing of pigs and poultry on large farms), waste management and wastewater. Due to the nature of the sectors, the scope of the European Pollutant Release and Transfer Register (E-PRTR) legislation and the selection of pollutants, these sectors represented a low amount of external costs to health and the environment, which could lead to misleading conclusions. Therefore, they have not been presented in this figure.
Source: See technical note (Estimating the external costs of industrial air pollution: Trends 2012-2021: Technical note on the methodology and additional results).
Click here for different chart formats and data
In 2021, the main polluting facilities were located in Germany, Poland, Italy, France, and Spain. These countries have the largest facilities and highest number of facilities reporting to the E-PRTR. When these costs are compared to the GDP as an indicator of relative environmental performance per unit of national economic output, the top five polluting facilities were in Bulgaria, Poland, Estonia, Greece, and Cyprus (Figure 3).
Considering the trends in external cost per country over the last decade, the relative contribution of countries remained fairly stable with very little changes to the top 5 considering absolute external costs and the ratio of external costs by GDP. Only Greece and Cyprus emerged in recent years as two of the top 5 in external costs normalised by GDP. It is worth considering, however, that Czechia would usually be one of the top countries in terms of absolute and normalised externalities, but they have not been presented in Figure 3 due to their failure to submit 2021 data.
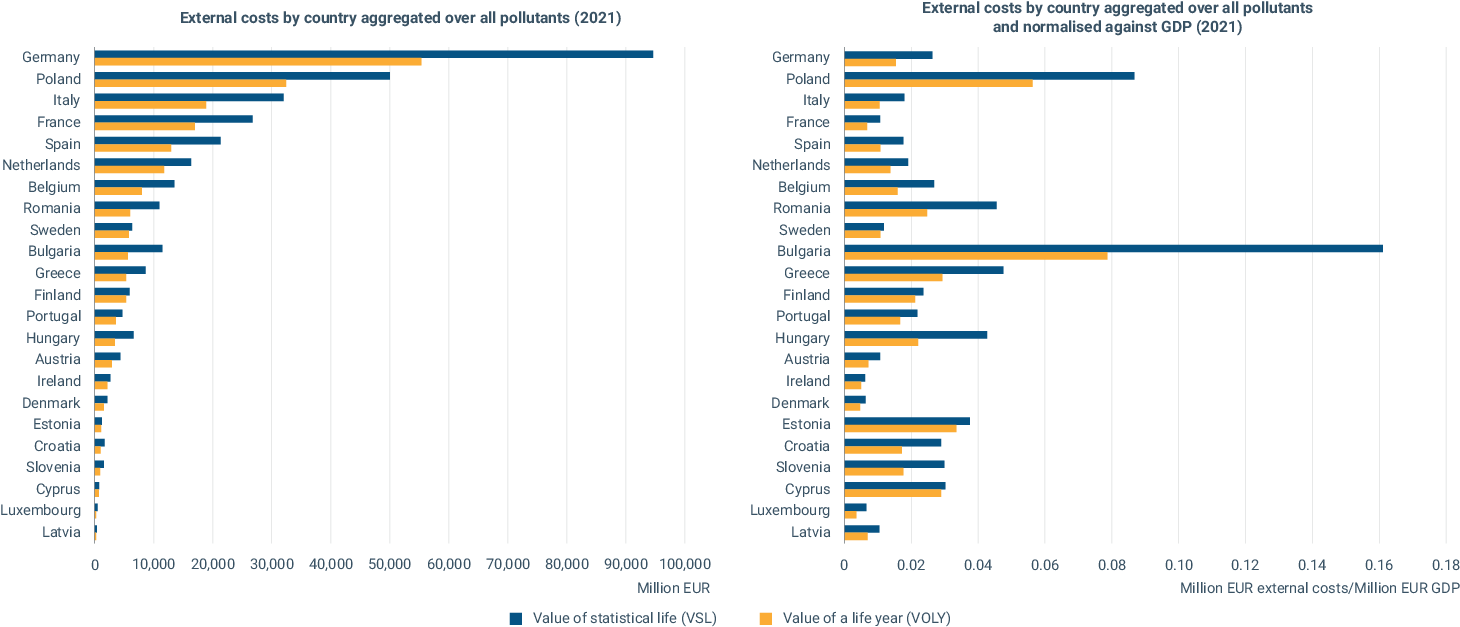
Notes: Mortality valued using the value of a life year (VOLY) and the Value of Statistical Life (VSL). The order in the ranking is based on the VOLY.
Euro price base: 2021.
Data gaps: Czechia, Malta, Lithuania, and Slovakia. No data reported for 2021.
Source: See technical note (Estimating the external costs of industrial air pollution: Trends 2012-2021: Technical note on the methodology and additional results).
Click here for different chart formats and data
Notes
An error in the data for external costs caused has been corrected in the briefing and the technical note that underpins it, as has the resulting ranking of facilities. Facility "DJP - De Hoop BV", located in the Netherlands with Inspire ID NL.RIVM/000064335.FACILITY, appeared wrongly as the facility with the highest external costs caused in 2021 in Map 1 of the briefing, as well as Map 4.1 and Table 4.4 of the technical note. The new maps and table now show the correct data and ranking.
The data on total external costs per pollutant group, externalities by country and externalities by sector which can be seen in the briefing did not contain this error and are unaffected.
The corrected versions of briefing and technical note were published on 29/04/2024.
[1] The high and low percentages correspond to the relative weight of GHGs, heavy metals or organic pollutants in the total external costs, depending on whether the health impacts from the main air pollutants are calculated using the VSL or the VOLY. Using the VOLY, the other pollutant groups represent a higher proportion of total costs, and vice versa when using the VSL.
[2] As opposed to air pollutants, GHG externalities are calculated based on the carbon abatement cost required to comply with the Paris Agreement, which seeks to limit global warming increase to below 2°C above pre-industrial temperatures.
[3] This corresponds to air emissions from livestock in the scope of the E-PRTR Regulation: Installations for intensive rearing of poultry or pigs: i) with 40,000 places for poultry, ii) with 2,000 places for production pigs over 30 kg and iii) with 750 places for sows. Cattle farming, which is now the biggest source of methane and the second biggest source of ammonia emissions to the air from agriculture, does not report to E-PRTR and consequently, is not reported in the European Industrial Emissions Portal.
[4] Since the scope of the assessment is air emissions, this sector had the least externalities. However, it causes environmental pollution due to water emissions.
References
EC, 2023, Proposal for a Regulation of the European Parliament and of the Council on establishing a framework of measures for strengthening Europe’s net-zero technology products manufacturing ecosystem (Net Zero Industry Act) (COM(2023) 161 final), European Commission.
EC, 2022, Proposal for a Directive of the European Parliament and of the Council amending Directive 2010/75/EU of the European Parliament and of the Council of 24 November 2010 on industrial emissions (integrated pollution prevention and control) and Council Directive 1999/31/EC of 26 April 1999 on the landfill of waste (COM/2022/156 final/3), European Commission.
EC, 2021a, Communication from the Commission to the European Parliament, the Council, the European Economic and Social Committee and the Committee of the Regions - Updating the 2020 New Industrial Strategy: Building a stronger Single Market for Europe’s recovery (COM/2021/350 final), European Commission.
EC, 2021b, Communication from the Commission to the European Parliament, the Council, the European Economic and Social Committee and the Committee of the Regions Pathway to a Healthy Planet for All EU Action Plan: 'Towards Zero Pollution for Air, Water and Soil' (COM/2021/400 final), European Commission.
EC, 2019, Communication from the Commission to the European Parliament, the Council, the European Economic and Social Committee and the Committee of the Regions — The European Green Deal, (COM(2019) 640 final), European Commission.
EEA, 2023, ‘Emissions and energy use in large combustion plants in Europe’, EEA official indicator IND006, European Environment Agency (https://www.eea.europa.eu/en/analysis/indicators/emissions-and-energy-use-in) accessed 25 August 2023.
EEA, 2022, ‘Zero pollution monitoring assessment’, Web report No 03/2022, European Environment Agency (https://www.eea.europa.eu/publications/zero-pollution).
EEA, 2021, ‘Counting the costs of industrial pollution’, Briefing No 10/2021, European Environment Agency.
EEA, 2019, Assessing the effectiveness of EU policy on large combustion plants in reducing air pollutant emissions, EEA Report No 07/2019, European Environment Agency.
OECD, 2012, Mortality Risk Valuation in Environment, Health and Transport Policies, Organisation for Economic Co-operation and Development.
Schucht, S., et al., 2021, Costs of air pollution from European industrial facilities 2008–2017, ETC/ATNI report 04/2020, European Topic Centre Health and Environment (when the work was undertaken, the name of the ETC was Air Pollution, Transport, Noise, and Industrial Pollution or ETC/ATNI).
Identifiers
Briefing no. 24/2023
Title: The costs to health and the environment from industrial air pollution in Europe – 2024 update
EN HTML: TH-AM-24-001-EN-Q - ISBN: 978-92-9480-624-6 - ISSN: 2467-3196 - doi: 10.2800/912907
EN PDF: TH-AM-24-001-EN-N - ISBN: 978-92-9480-623-9 - ISSN: 2467-3196 - doi: 10.2800/957087



Document Actions
Share with others