All official European Union website addresses are in the europa.eu domain.
See all EU institutions and bodies
An official website of the European Union | How do you know?
Environmental information systems
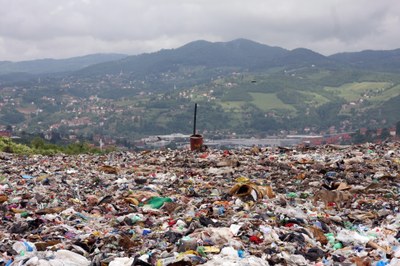
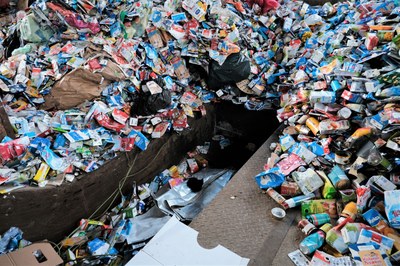
Key messages: Waste generation continues increasing in the EU, with a slight decrease of 0.5% between 2010 and 2022, with a sharp decrease between 2018 and 2020, which might be due to economic slowdown linked to the COVID-19 pandemic.When major mineral wastes —generally less environmentally concerning— are excluded from the totals, waste generation increased by 3.3% between 2010 and 2022. Waste generation closely follows economic growth trends, suggesting that the Zero Pollution Action Plan target to significantly reduce total waste generation by 2030 is unlikely to be met.
Waste generation per capita in the EU (total and waste excluding major mineral waste), indexed to 2010 and compared with GDP, 2010-2022
Loading chart...
The EU has long aimed to reduce waste generation. The EU Waste Framework Directive establishes the waste management hierarchy, where preventing waste is the preferred option. Following the Directive, Member States must develop Waste Prevention Programmes, with progress monitored by the European Environment Agency (EEA, 2023a). The EU's zero pollution goal aims to significantly decrease total waste generation by 2030.
Total waste generation per capita in the EU showed a slight decrease (0.5%) between 2010 and 2022 (from 5 to 4.99 tonnes/capita). After a notable decline between 2018 and 2020 (0.4 tonnes decrease, close to 8% decrease) due to the COVID-19 pandemic and economic slowdown, waste generation continued increasing between 2020 and 2022 in the EU (0.2 tonnes increase, 3.6% increase).Major mineral wastes from mining and construction form a significant portion of total waste, while they are generally less environmentally concerning due to its inert nature. Waste generation excluding major mineral waste increased 3.3% over the period 2010-2022 (from 1.72 to 1.77 tonnes per capita). Between 2010 and 2018, it increased by 100 kg, followed by decline of 84 kg between 2018 and 2020, and increasing again (41 kg) between 2020 and 2022. While most waste is classified as non-hazardous, more than 5% is hazardous (according to 2022 data) (see signal Hazardous waste generation in the EU-27).
Economic growth, measured by gross domestic product (GDP), is the main driver of waste volume trends. From 2010 to 2022, waste generation (excluding major mineral waste) grew more slowly than economic activity, which grew by 18.6%. This suggests a relative decoupling between waste generation and GDP.
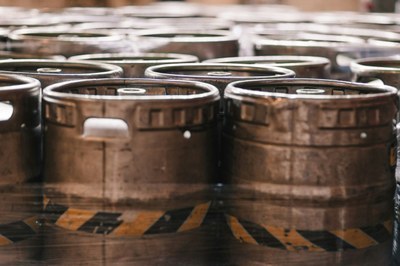
Waste generation decreased in the manufacturing and energy sectors while increasing for households, and water and waste treatment activities. This increase mirrors a rise in secondary waste (i.e. waste generated by waste management activities) and indicates improvements in waste management and increased recycling efforts.
Despite the relative decoupling between waste generation and GDP over the 2010-2022 period, significantly reducing waste generation, as outlined in the Zero Pollution Action Plan and the 8th EAP (EEA, 2023b), has not yet been achieved by the EU.
Please consult the relevant indicators and signals below for a more comprehensive overview on the topic.
Zero Pollution Action Plan 2030 target or policy objectives
- Significantly reduce total waste generation.
- Waste prevention: significantly reduce the total amount of waste generated by 2030 (EEA, 2023b).
Return to the main pages:
Other relevant indicators and signals
References and footnotes
- ↵EEA, 2023a, ‘Tracking waste prevention progress — A narrative-based waste prevention monitoring framework at the EU level’, (https://www.eea.europa.eu/publications/tracking-waste-prevention-progress),accessed May 2024.
- Figure considering total waste, i.e. accounting also for major mineral waste.↵
- a bEEA, 2023b, ‘8th EAP – indicator-based progress – 2023’, European Environment Agency (https://www.eea.europa.eu/en/topics/at-a-glance/state-of-europes-environment/environment-action-programme/8th-eap-indicator-based-progress-2023) accessed 2 August 2024.