All official European Union website addresses are in the europa.eu domain.
See all EU institutions and bodies
An official website of the European Union | How do you know?
Environmental information systems
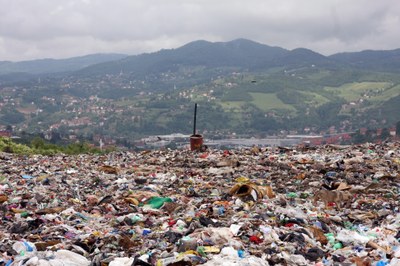
Key messages: In 2022, hazardous waste represented 5.3% of the 2.2 billion tonnes of waste generated in the EU-27. Hazardous waste amounts have been growing since 2016, with a drop during the Covid-19 period, and a further continuation of the increasing trend, reaching a peak in 2022, heavily due to the increase of mineral waste.
Hazardous waste generation in the EU-27
Loading chart...
Hazardous waste can pose significant risks to humans and the environment if not managed properly. Reducing waste is a fundamental EU environmental policy objective — and is the first step in the waste hierarchy of the EU Waste Framework Directive (EU, 2008). This directive establishes additional obligations around hazardous waste and bans both the mixing of different categories of hazardous waste as well as mixing hazardous with non-hazardous waste. More recently, the zero-pollution ambition has set a target to significantly reduce total waste by 2030, including also hazardous waste.
In 2022, the EU generated 119 million tonnes of hazardous waste, representing 5.3% of the EU’s total waste generation. This proportion has remained broadly stable over the past decade, with a net increase close to 2 percent points over the whole period, with 0.9 points increase just between 2020 and 2022. Since 2010 hazardous waste generated through EU economic activity showed an increasing trend, peaking in 2022. The net change over the whole period is a 31% increase, from 90.8 to 119 million tonnes.
Hazardous waste generation can present conflicting signals in terms of environmental protection. Increased waste generation is generally seen as problematic, as it can indicate inefficient resource use and presents an environmental risk — elevated with hazardous substances. However, increased levels of hazardous waste generation can also signal its improved segregation and collection, representing an improved environmental outcome.
Despite general stability, several elements within this data set exhibit a high degree of fluctuation over the past decade. This period has seen some significant reclassifications of waste between hazardous and non-hazardous categories. For example, the reclassification of oil shale waste from hazardous to non-hazardous in Estonia in 2020 resulted in a decline of close to nine million tonnes of hazardous waste (combustion wastes) compared to previous years. Reclassifications in other material streams have also caused large increases in hazardous waste over the reporting period.
Some of the larger material streams have seen notable increases in both absolute and relative terms since 2010. These include mineral waste from mining activities (up 188%, and more than doubling between 2020 and 2022, partly due to a reclassification of some of this from non-hazardous to hazardous), construction and demolition (31%), and waste treatment (19%). There were also notable increases in waste from sorting residues (up 120%), discarded equipment (49%) and dredging spoils (25%).
More generally, the increase between 2010 and 2022 in waste from waste treatment operations (secondary waste) (up 44%) is likely associated with increased treatment activity resulting from improved management across waste streams. The increase in mineral waste from construction and demolition may reflect improvements in the removal of hazardous substances from buildings upon demolition. Increases in discarded equipment are likely linked to better separate collection of waste electrical and electronic equipment. The increase in dredging spoils may be due to occurrences of sporadic large-scale dredging operations.
Key areas where hazardous waste generation decreased over the same period, include mixed and undifferentiated materials (down 67%, yet with a 10% increase between 2020 and 2022), acid, alkaline or saline wastes (25%), soils (5%) (whose variation over time and the factors underlying these changes are not clear) and spent solvents (31%). However, the large-volume category of chemical wastes shows only a modest reduction (down -7%), likely linked to increasing levels of chemical production and consumption (see indicator Production and consumption by hazard class).
Please consult the relevant indicators and signals below for a more comprehensive overview on the topic.
Zero Pollution Action Plan 2030 target or policy objectives
- Significantly reduce total waste generation.
Return to the main pages:
Other relevant indicators and signals
References and footnotes
- EU, 2008, Directive 2008/98/EC of the European Parliament and of the Council of 19 November 2008 on waste and repealing certain Directives (OJ L 312, 22.12.2008).↵
- ↵ESPAS, 2023, ‘Welcome To 2030: The mega-trends’ (https://ec.europa.eu/assets/epsc/pages/ espas/chapter1.html) accessed 18 October 2023.
- ↵EUROSTAT, 2024 Generation of waste by waste category, hazardousness and NACE Rev. 2 activity (env_wasgen) https://ec.europa.eu/eurostat/databrowser/view/env_wasgen/default/table?lang=en, accessed 03 October 2024