All official European Union website addresses are in the europa.eu domain.
See all EU institutions and bodies
An official website of the European Union | How do you know?
Environmental information systems
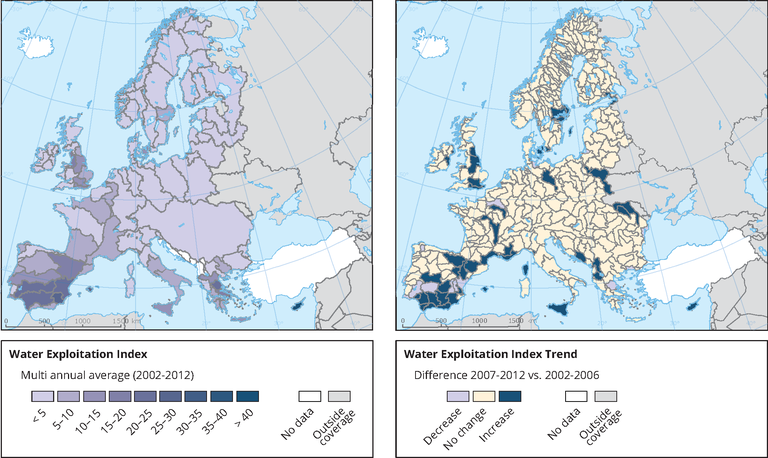
The maps shows the annual total water abstraction as a percentage of available long-term freshwater resources 2002–2012 (left) and average trend 2007–2012 compared to 2002–2006 (right)
Loading