All official European Union website addresses are in the europa.eu domain.
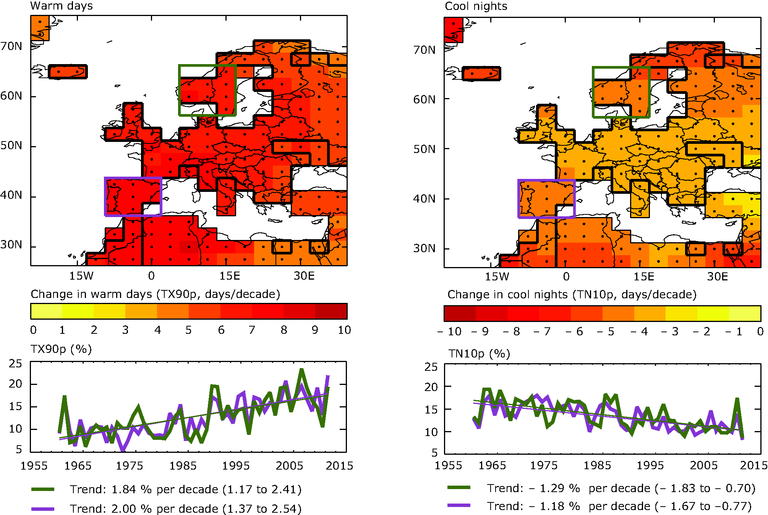
See all EU institutions and bodiesWarm days are defined as being above the 90th percentile of the daily maximum temperature and cool nights as below the 10th percentile of the daily minimum temperature (Alexander et al., 2006). Grid boxes outlined in solid black contain at least three stations and so are likely to be more representative of the grid-box. High confidence in the long-term trend is shown by a black dot. (In the maps above, this is the case for all grid boxes.) Area averaged annual time series of percentage changes and trend lines are shown below each map for one area in northern Europe (green line, 5.6 ° to 16.9 °E and 56.2 ° to 66.2 °N) and one in south-western Europe (purple line, 350.6 ° to 1.9 °E and 36.2 ° to 43.7 °N).
Loading

