All official European Union website addresses are in the europa.eu domain.
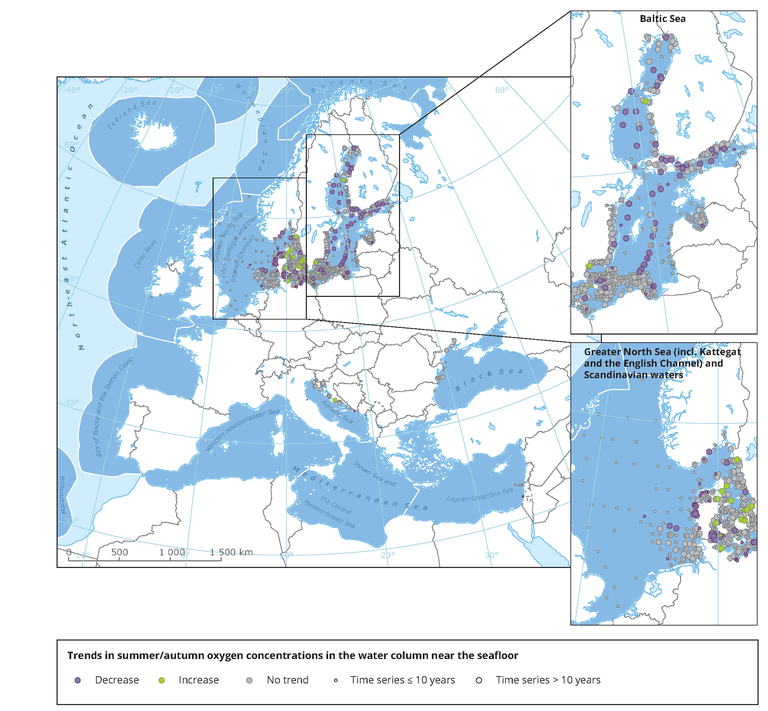
See all EU institutions and bodiesThe map shows trends per station in dissolved oxygen concentrations in the water column near the seafloor, observed in summer/autumn of the years 1990-2017. Purple: significant decrease; green: significant increase; grey: no significant trend. Small symbols: ≤10 years of data; large symbols: >10 years of data.
Loading

