All official European Union website addresses are in the europa.eu domain.
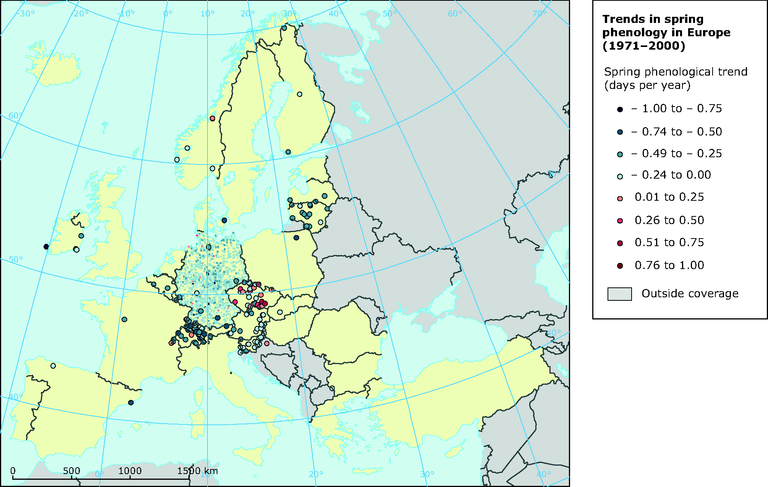
See all EU institutions and bodiesThis figure shows the spring trends of phenology 1971-2000 grouped by their mean onset date. Each dot represents a station. Dot size adjusted for clarity. A negative phenological trend corresponds to an earlier onset of spring.
Loading

