All official European Union website addresses are in the europa.eu domain.
See all EU institutions and bodies
An official website of the European Union | How do you know?
Environmental information systems
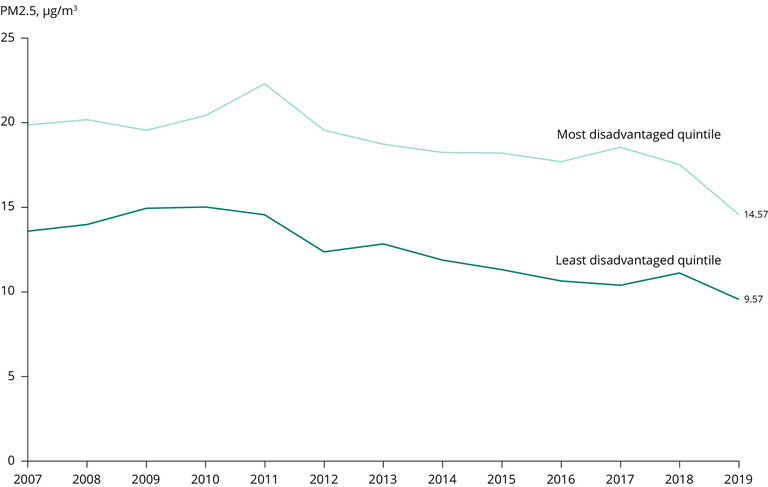
The graph represents the trend of annual average annual concentrations of particles of a diameter of less than 2.5 microns in ambient air concentration, weighted by population, by year and for the entire EU, for the richest quintile (top 20% in terms of GDP, gross domestic product, per capita) and the poorest quintile (bottom 20% in terms of GDP per capita). In the graph, one can see that both the richest regions and the poorest regions in the EU are improving their air quality (i.e. PM₂.₅ concentrations are decreasing), but the richest are doing so from lower starting levels and significantly faster than the poorest.
Loading