All official European Union website addresses are in the europa.eu domain.
See all EU institutions and bodies
An official website of the European Union | How do you know?
Environmental information systems
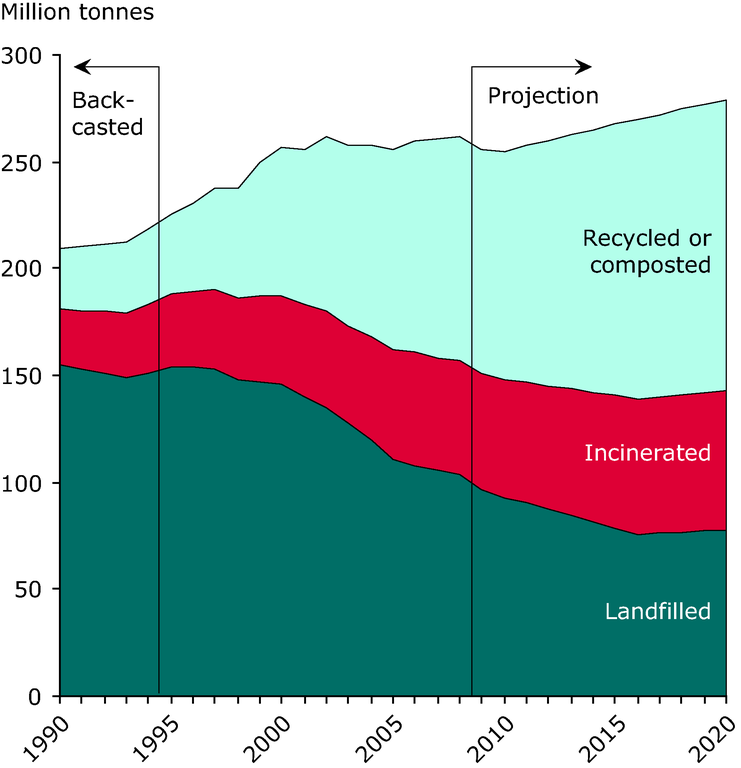
This figure shows the waste generation in the EU-27 (without Cyprus) plus Norway and Switzerland and the distribution between treatment paths from 1990 to 2020.
Loading