All official European Union website addresses are in the europa.eu domain.
See all EU institutions and bodiesIndustrial releases of pollutants to air and economic activity in the EU-27
Chart (static)
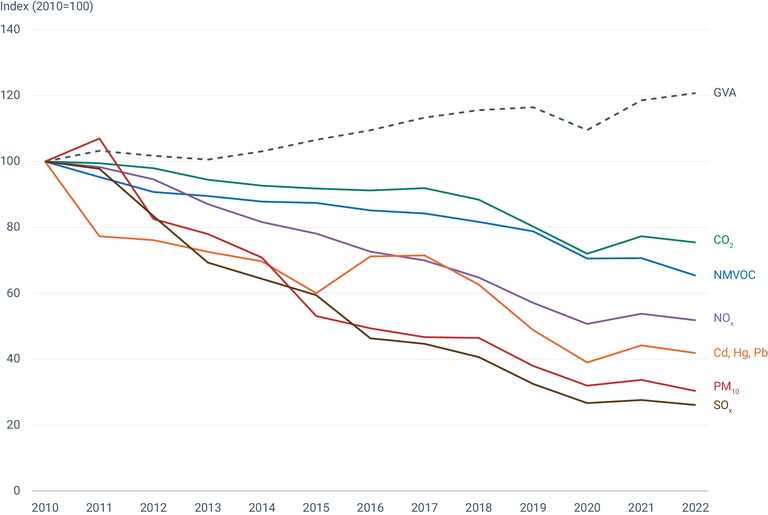
The figure shows the trend of pollutant releases into air in the EU-27 from 2010 to 2022 by using 2010 releases values as reference. In addition, gross value added (GVA) from the industry sector is presented.

- Industrial Reporting under the Industrial Emissions Directive 2010/75/EU and European Pollutant Release and Transfer Register Regulation (EC) No 166/2006 - ver. 10.0 Dec 2023 (Tabular data)
- Austria
- Belgium
- Bulgaria
- Croatia
- Cyprus
- Czechia
- Denmark
- Estonia
- Finland
- France
- Germany
- Greece
- Hungary
- Ireland
- Italy
- Latvia
- Lithuania
- Luxembourg
- Malta
- Netherlands
- Poland
- Portugal
- Romania
- Slovakia
- Slovenia
- Spain
- Sweden
Methodology
Pollutant releases reported under European Pollutant Release and Transfer Register (E-PRTR)/Large Combustion Plants (LCP) LCP dataflow for the relevant pollutant have been aggregated at EU-27 level and index against 2010 level has been calculated.
Additional information
GVA, gross value added; NMVOC, non-methane volatile organic compound; NOx, nitrogen oxides; PM10, particulate matter with a diameter of less than 10μm; SOx, sulphur oxides. GVA is used as a proxy for the economic activity of industry in Europe, accounting for inflation, based on 2010 values.
Slovakia: data from 2018 to gap fill 2019-2022
Malta: data from 2019 to gap fill 2020-2022
Czechia: data from 2020 used to gap fill 2021-2022
Bulgaria: 2021 data used to gap fill 2022 due to late reporting
