All official European Union website addresses are in the europa.eu domain.
See all EU institutions and bodiesAn official website of the European Union | How do you know?
Environmental information systems
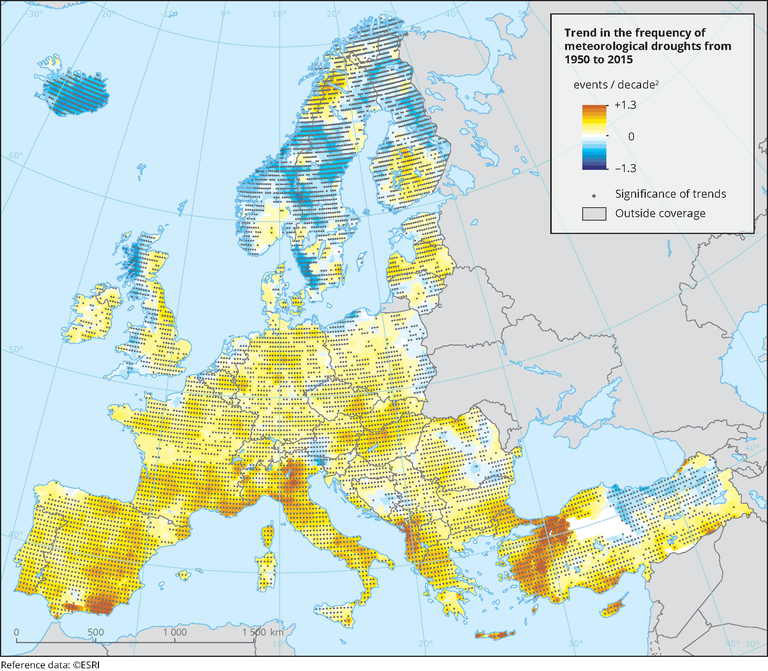
Trend in the frequency of meteorological droughts in Europe (1950-2015)
Map (static)
Hatching indicates the areas in which the trends are statistically significant at the 95 % percent level.

Downloads
Data sources
Metadata
More info
Loading
- Trend in annual meteorological drought frequency (copyright-protected)
- Albania
- Austria
- Belgium
- Bosnia and Herzegovina
- Bulgaria
- Croatia
- Cyprus
- Czechia
- Denmark
- Estonia
- Finland
- France
- Germany
- Greece
- Hungary
- Iceland
- Ireland
- Italy
- Kosovo
- Latvia
- Liechtenstein
- Lithuania
- Luxembourg
- Malta
- Montenegro
- Netherlands
- North Macedonia
- Norway
- Poland
- Portugal
- Romania
- Serbia
- Slovakia
- Slovenia
- Spain
- Sweden
- Switzerland
- Turkey
- United Kingdom
1950-2015
Additional information
JRC: Sciene for Disaster Risk Management 2017, doi:10.2788/842809, Figure 3.35. A drought event is defined as a continuous period of at least two months in whicht the SPI-3 is below -1 (see Spinoni et al. 2017, doi:10.1016/j.gloplacha.2016.11.013).Trends are expressed in number of events per decade squared. For example, a trend of +1 means that a location will experience each decade, on average, one drought event more than in the previous decad.
