All official European Union website addresses are in the europa.eu domain.
See all EU institutions and bodies
An official website of the European Union | How do you know?
Environmental information systems
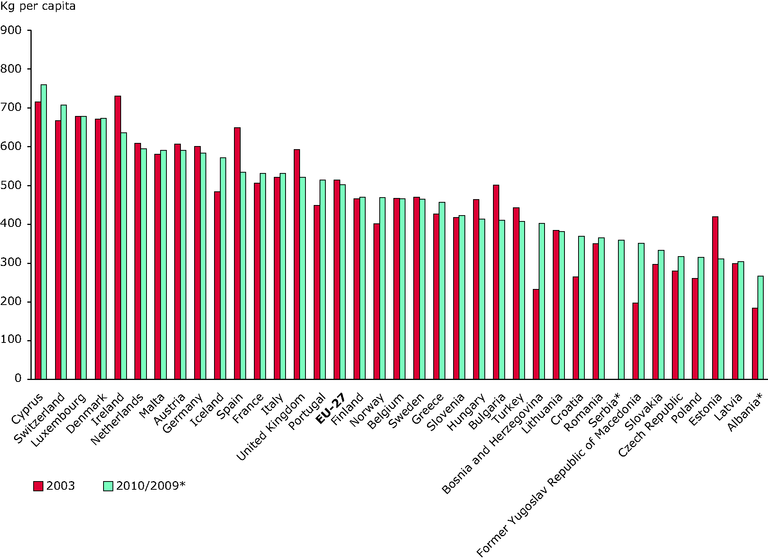
The figure is a bar plot of the generation of municipal waste in kg per capita, covering 2003 and 2010.
Loading