All official European Union website addresses are in the europa.eu domain.
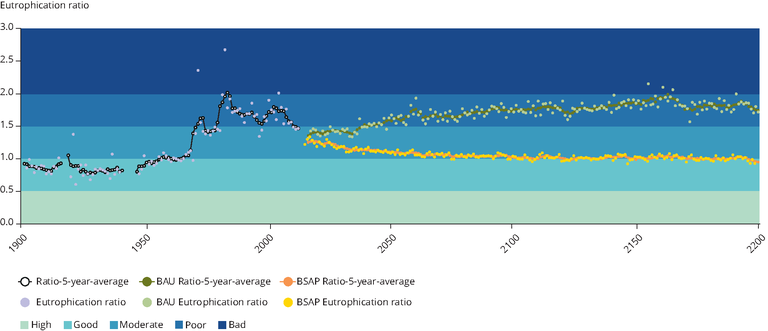
See all EU institutions and bodiesThe chart shows the average Eutrophication Ratio for the entire Baltic for each year from 1900 to 2200, as well as a 5-year moving average. The eutrophication ratio is calculated by the HEAT tool. A value above 1 indicates that there is a Eutrophic status. A value below 1 indicate a good (non-eutrophic status).
Loading

