All official European Union website addresses are in the europa.eu domain.
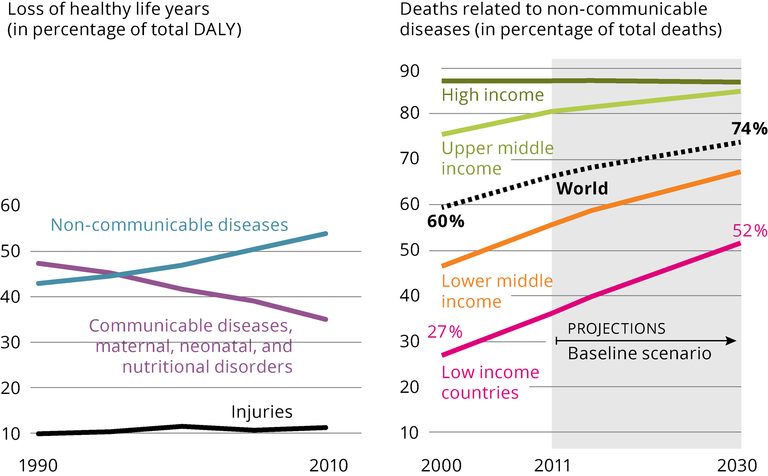
See all EU institutions and bodiesThe graphs compares the shift from communicable to non-communicable diseases globally (left panel) with the (future) development of non-communicable diseases across world income regions.
Loading

