All official European Union website addresses are in the europa.eu domain.
See all EU institutions and bodies
An official website of the European Union | How do you know?
Environmental information systems
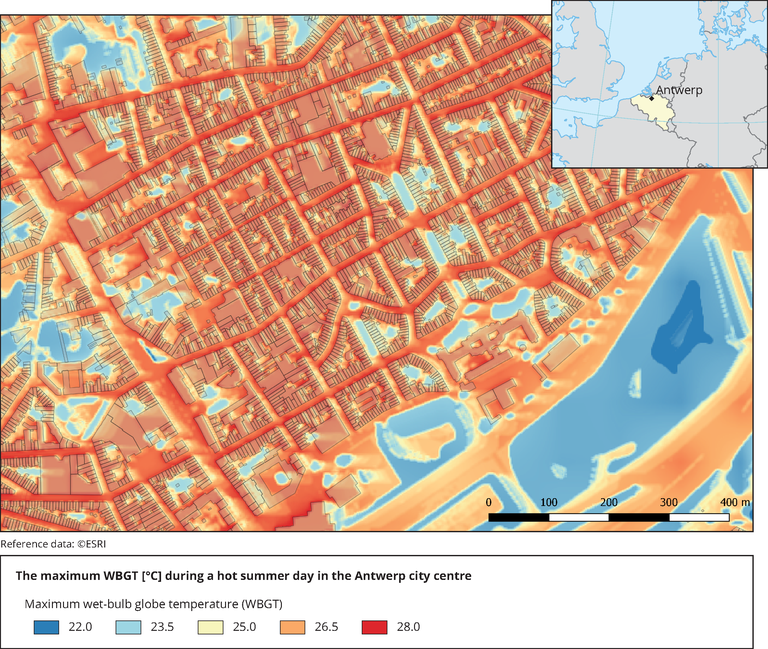
The map shows the maximum WBGT values; those exceeding 25 °C indicate heat stress. Locations with trees and/or water surfaces are the coolest, whereas the highest heat stress values are found over paved squares and streets where there is no shading.
Loading