All official European Union website addresses are in the europa.eu domain.
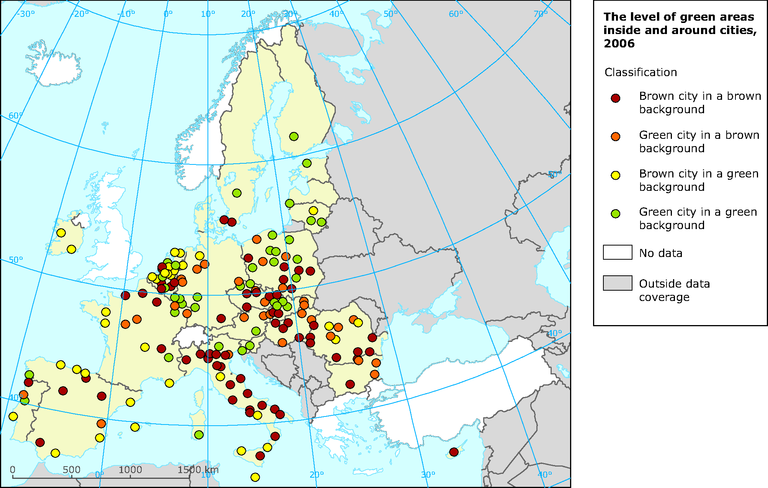
See all EU institutions and bodiesThe map shows the relation of green urban areas to the green background, i.e. it compares the mean value of green background of the city surroundings with the mean values of green urban areas of the core cities, both in [%]. Results are represented by points of different colours.
Loading

