All official European Union website addresses are in the europa.eu domain.
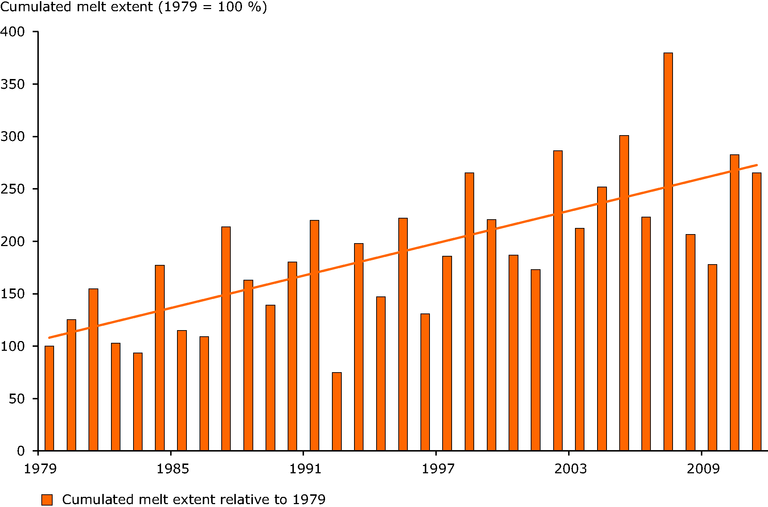
See all EU institutions and bodiesThe figure shows the change in yearly cumulated area of the Greenland ice sheet and it's melt during the period 1979 to 2011 in percentage relative to area in 1979=100. The linear trend 1979–2011 is included.
Loading

