All official European Union website addresses are in the europa.eu domain.
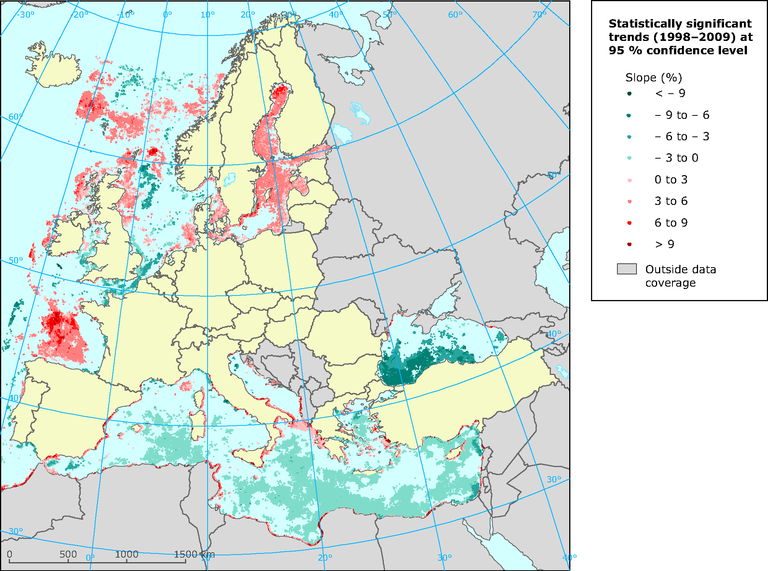
See all EU institutions and bodiesStatistically significant trends of ocean colour intensity 1998–2009
Map (static)
The figure shows statistically significant trends of ocean colour intensity 1998–2009 at the 95 % confidence level (Mann–Kendall test)

- Albania
- Belgium
- Bosnia and Herzegovina
- Bulgaria
- Croatia
- Cyprus
- Denmark
- Estonia
- Finland
- France
- Germany
- Greece
- Iceland
- Ireland
- Italy
- Latvia
- Lithuania
- Malta
- Montenegro
- Netherlands
- Norway
- Poland
- Portugal
- Romania
- Russia
- Serbia
- Slovenia
- Spain
- Sweden
- Turkey
- United Kingdom
Methodology
For each grid point a time series of summer mean Chl-a concentration was calculated for the period 1998-2009, using the same definition of summer as in the observations. The trend in these time series are tested for significance using the Mann-Kendall test.
Additional information
This analysis is based on satellite observations of ocean colour which is equivalent to chl-a. A global dataset covering the period 1998-2009 and without regional corrections has been used. This dataset is most accurate in the Mediterranean Sea. In the Black Sea, few in-situ observations are available and the satellite imagery is unverified. In the Baltic Sea high concentrations of humic substances in the sea requires a regional correction of the satellite observations, making the analysis less certian in this area.
