All official European Union website addresses are in the europa.eu domain.
See all EU institutions and bodies
An official website of the European Union | How do you know?
Environmental information systems
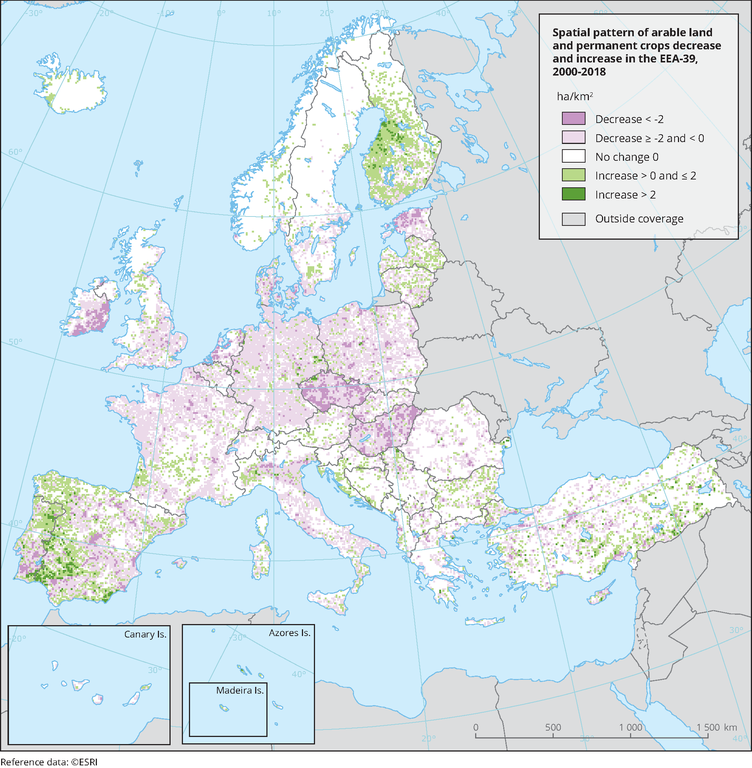
The map shows the loss and gain of arable land and permanent crops aggregated in a 10 km grid.
The following CLC classes were used:
211 Non-irrigated arable land,
212 Permanently irrigated land,
213 Rice fields,
221 Vineyards,
222 Fruit trees and berry plantations,
223 Olive groves,
241 Annual crops associated with permanent crops.
Loading