All official European Union website addresses are in the europa.eu domain.
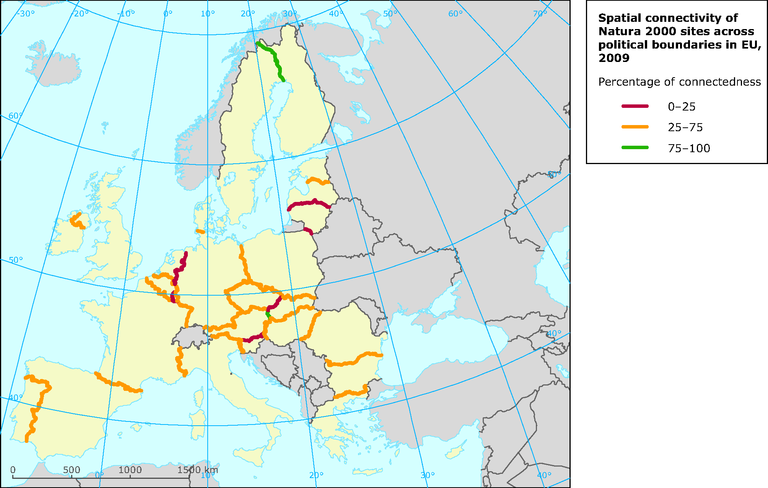
See all EU institutions and bodiesThe map reflects the likely degree of spatial connectivity of Natura 2000 sites across 34 terrestrial political borders of the EU, measured as a quantified proportion of Natura 2000 sites on both sides of a boundary against total border length. A thick line reflects a likely poor spatial connectivity while a thin line reflects a likely good spatial connectivity.
Loading

