All official European Union website addresses are in the europa.eu domain.
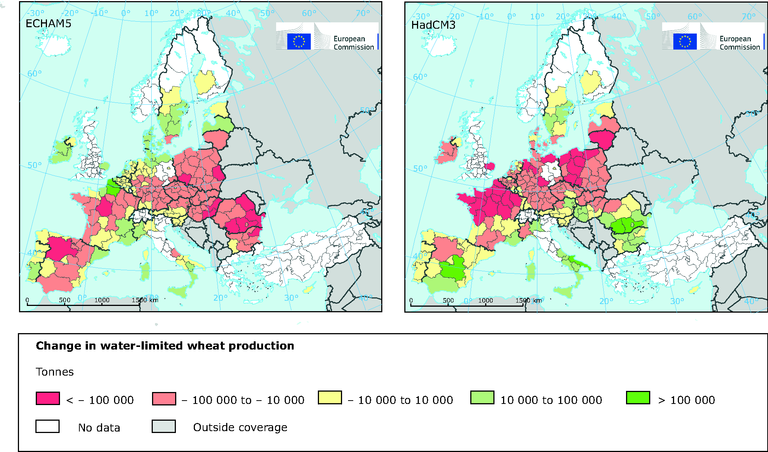
See all EU institutions and bodiesThe figure shows the simulated change in water-limited wheat production for 2030 compared with 2000 for the A1B emission scenario using a cold (ECHAM5) (left) and a warm (HADCM3) (right) climate change projection.
The simulation was performed on a 25x25 km grid (assuming current area of wheat cropping) but the results are presented here at the NUTS-2 level.
Loading

