All official European Union website addresses are in the europa.eu domain.
See all EU institutions and bodies
An official website of the European Union | How do you know?
Environmental information systems
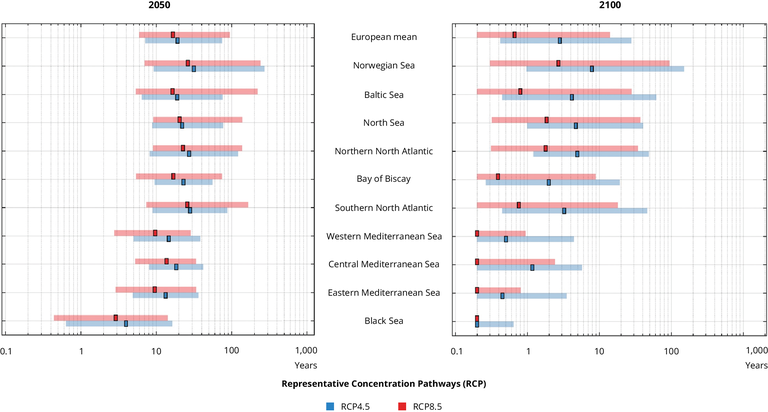
Solid coloured boxes show the ensemble mean value and coloured shading shows the inter‐model variability (from worst to best case). The mean value for the entire European coastline and values for the coasts of 10 geographical regions are shown.
N-North, northern part of the North Atlantic; S-North Atlantic, southern part of the North Atlantic; RCP, representative concentration pathway; RCP4.5: medium emissions scenario; RCP8.5: high emissions scenario
Loading