All official European Union website addresses are in the europa.eu domain.
See all EU institutions and bodies
An official website of the European Union | How do you know?
Environmental information systems
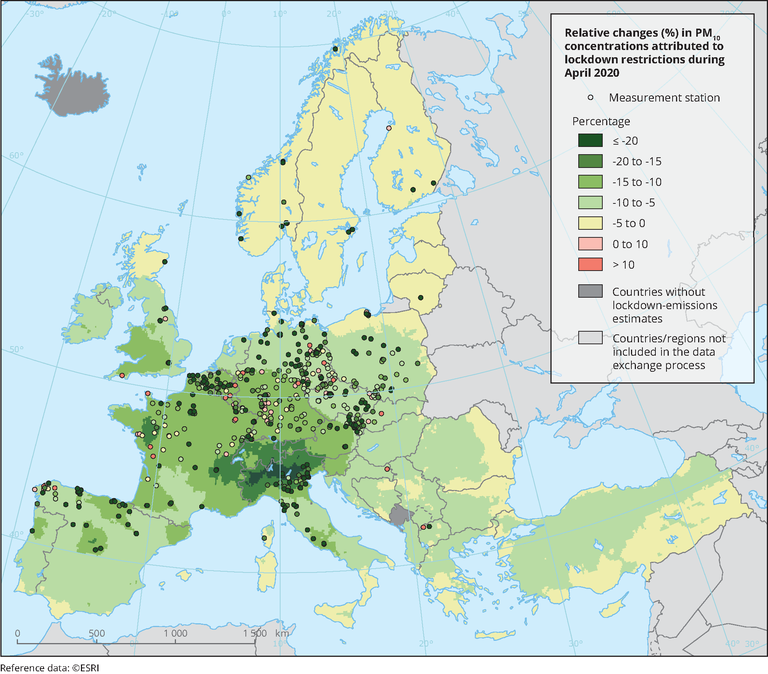
The dots represent measurements stations, where the changes have been estimated using UTD monitoring data and the generalized additive model (GAM). The background shading represents the changes estimated using CAMS chemical transport modelling with an emission inventory estimated for the lockdown conditions.
Loading