All official European Union website addresses are in the europa.eu domain.
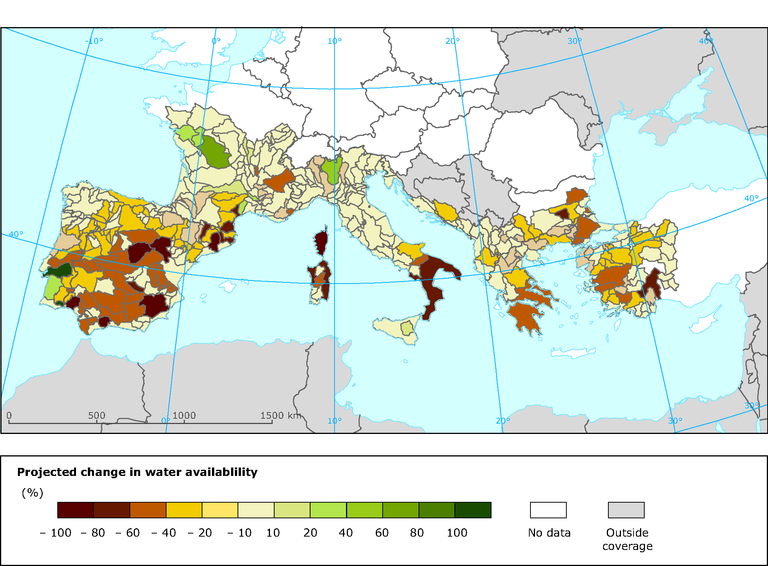
See all EU institutions and bodiesThis figure shows the relative change in water availability for irrigation as projected under the A1B emission scenario by the HIRHAM (DMI) regional climate model for 2071-2100 relative to 1961-1990. Light yellow areas indicate no change in water availability.
Loading

